If you ever find yourself in Volgograd, Russia, you will visit Rodina Mat’ Zovyot. It’s unavoidable. The statue, depicting Mother Russia calling her sons to battle against her invaders, is one of the tallest in the world. Standing almost 280 feet high, she is nearly twice as tall as the Statue of Liberty. Her colossal height is accentuated by her position at the summit of Mamayev Kurgan, the high ground overlooking Volgograd, whose great, grassy green slopes were fertilized by the blood of a quarter-million Soviet soldiers who died defending it from the invading Nazis during World War II, when the city was still known as Stalingrad.
You never know when you’re about to have an experience that will stay in your memory, and haunt you, for the rest of your life. Such was the moment when I first entered the glittering round chamber below the statue, where an eternal flame keeps alive the memory of the 20 million or so Russians who died in the war. I entered just at the beginning of the ceremony marking the changing of the guard. Young Russian soldiers in ill-fitting uniforms and black jack boots marched in painfully slow goose steps up the ramp around the perimeter of the chamber to relieve the previous sentries of their duty. It was impressive in the extreme. But, more than anything, I remember the haunting, plaintive choral music playing in the background (see this video). It perfectly expressed the quiet calm and peace that all who suffer in war must yearn for, if only in death. But when I asked my guide what the song was, I was flabbergasted by her reply: “Daydreams, by Schumann.”
What?! A Russian World War II memorial playing the music of a German composer? How could it be?
The U.S. economy has been hit with shelter-in-place orders that have depressed consumption and reduced production. The economic readings on Q2 will be historically bad, perhaps even worse than the Great Depression. However, based on the assumptions that (a) aggressive policy support will continue, and (b) the pandemic will wane over time, either due to natural herd immunity or medical intervention, financial markets are assuming the impact of COVID-19 will be severe in impact but short in duration. Although we mostly agree with that assessment, the rebound has much to do with how GDP is reported. The common way is to annualize the quarterly change. Thus, if we get a large decline in Q2, a very modest rise in GDP in Q3 will tend to look quite large. This is not the only way to measure the change in GDP. The year-on-year change will look less onerous in Q2 but won’t look as impressive in Q3.
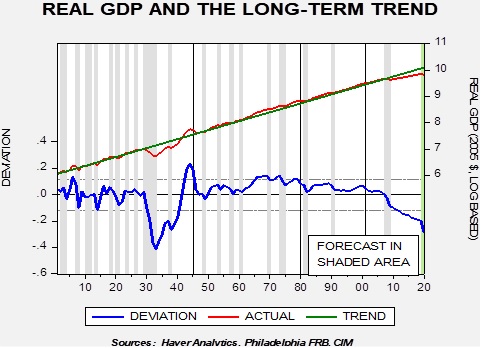
Another way we like to look at the GDP data is against its long-term trend. To forecast Q2 GDP, we are taking advantage of a new high-frequency index created by the New York FRB. The index is designed to measure the yearly change in GDP—how much GDP has changed compared to Q2 2019. It is currently forecasting about a 12% yearly change.[1] We can then take that number and calculate what the level of GDP looks like compared to its long-term trend.
To generate this chart, we log-transform real annual GDP and regress a time trend through the data. The important line is the lower deviation line. There are two periods when GDP was well below trend; the Great Depression and the post-Great Financial Crisis to the present. The Great Depression showed a massive drop in the level of GDP that took until 1942 to return to trend. Although fiscal and monetary policy were expanding after 1932, it took war spending to finally bring the economy back to trend. What has been disconcerting about the past expansion is that it was much slower than the long-term trend. And so, the level of GDP continued to fall compared to trend; our estimate for GDP in the COVID-19 recession shows a downleg in growth that is rivaling levels seen in 1935.
The point of this analysis is that the trend should represent some degree of capacity. It is possible the trajectory for GDP that held from 1901 to 2008 is no longer possible. But, if that trendline does represent a normal level for GDP, it would suggest the economy can absorb aggressive fiscal and monetary policy expansion before inflation becomes a problem. If inflation starts to rise before the trendline is achieved, it would confirm that the trendline is no longer valid; however, for the political class, it would seem natural to find out if the long-term trend line remains a measure of capacity. In other words, we would expect even more deficit spending and easy monetary policy until inflation returns. Given how far GDP remains below trend, the return of inflation may take a rather long time.
by Bill O’Grady, Thomas Wash, and Patrick Fearon-Hernandez, CFA
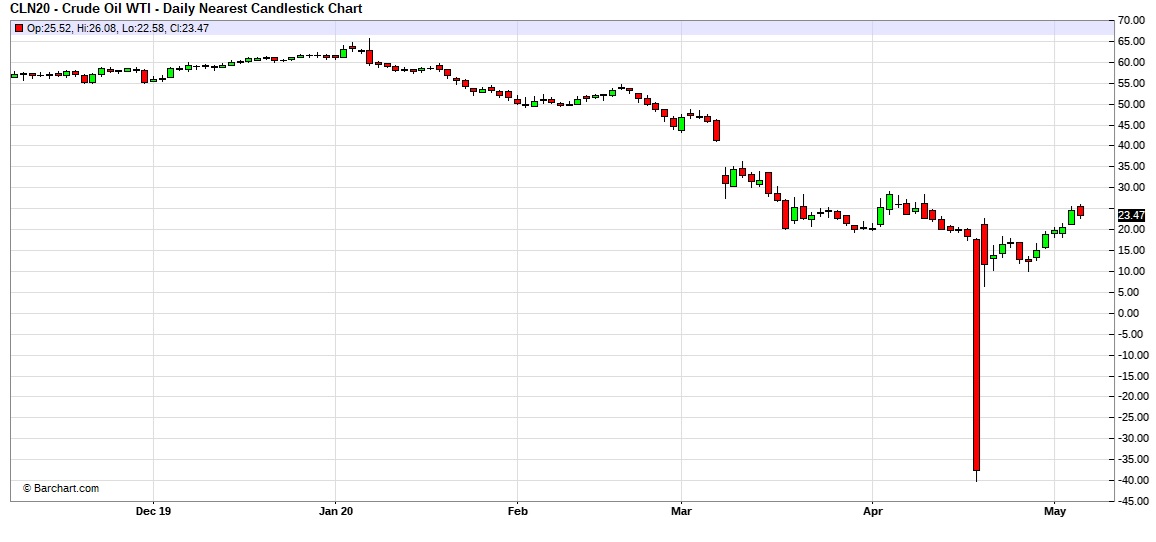
Here is an updated crude oil price chart. The oil market is showing signs of recovery.
(Source: Barchart.com)
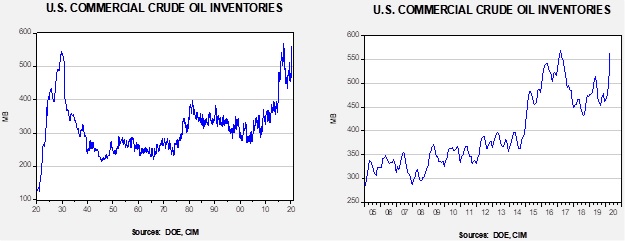
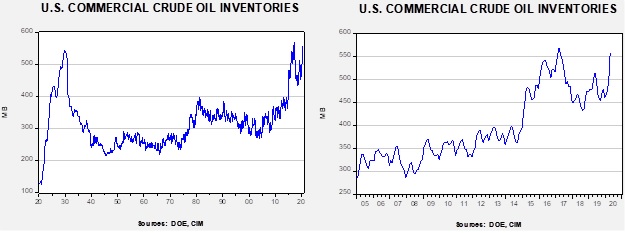
Crude oil inventories rose 4.6 mb compared to the forecast rise of 8.0 mb.
In the details, U.S. crude oil production fell 0.2 mbpd to 11.9 mbpd. Exports rose 0.4 mbpd, while imports rose 0.2 mbpd. Refining activity rose 0.9%, a bit more than the 0.8% rise forecast. The inventory build was mostly due to continued elevated U.S. production, although the pace of the rise is starting to slow.
(Sources: DOE, CIM)
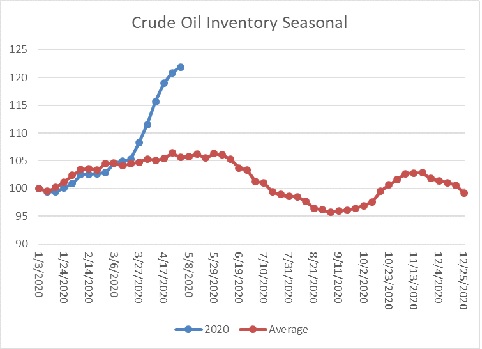
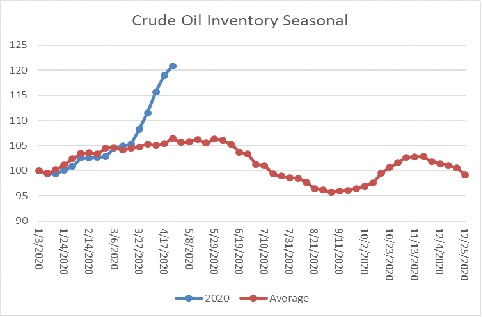
The above chart shows the annual seasonal pattern for crude oil inventories. The last six weeks have pushed stockpiles almost “off the charts,” although there is evidence to suggest the pace of inventory injections is starting to peak.
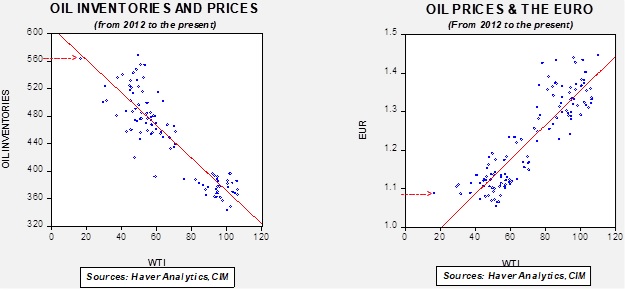
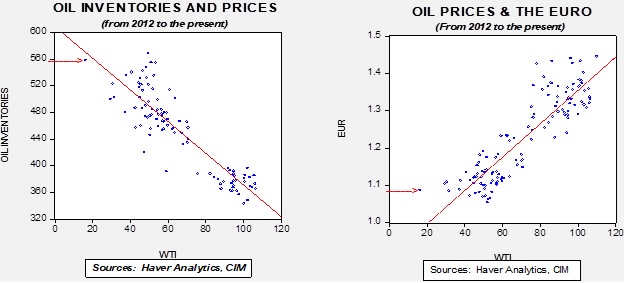
Based on our oil inventory/price model, fair value is $29.18; using the euro/price model, fair value is $44.58. The combined model, a broader analysis of the oil price, generates a fair value of $36.58. As we noted recently, the model output is less relevant as there is a non-linearity tied to the loss of storage capacity that cannot be fully captured with these models. At the same time, if storage remains available, the models would suggest upside for oil prices. We also note that the Eurozone could be roiled by German court decisions which could limit the flexibility of the ECB to support the Eurozone economy. This outcome would be bearish for the euro and may weaken it further, which would be bearish for oil prices.
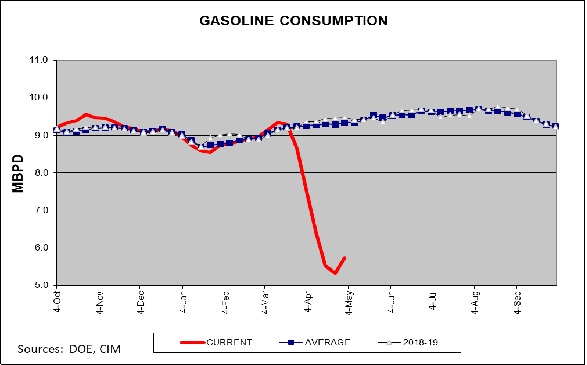
Although consumption remains depressed, gasoline data does show that a bottoming may be underway.
The weekly reporting is showing a steady decline in oil production. Media reporting is confirming this trend as well. The Fed has expanded its loan program to offer help to energy companies but there is little chance that it will be enough to protect smaller firms. Longer term, there is growing concern among oil companies that oil demand may never return to pre-COVID-19 levels. If that is the case, it will have profound effects on the energy industry. Between the slow recovery and climate change legislation, oil consumption may have already peaked. If so, higher cost reserves may not be recoverable. It isn’t just oil that is affected; coal is also affected because weak prices for oil and natural gas will further weaken demand for coal as well.
In international news, Iran’s OPEC governor suffered a severe brain hemorrhage. It is unlikely he will return to his post, but we doubt this will change Iran’s oil policy. Israeli sources suggest that Iran may be reducing its support for Syria. Recent bombing attacks by the IDF have brought little response from Tehran. Consequently, Israel has stepped up its attacks. We suspect two events have led to Iran’s pullback. The first is that the assassination of Qasem Soleimani has reduced Iran’s ability to manage the relationship with Hezbollah in Syria. Soleimani was a strong leader and his death may have created a leadership vacuum outside of Iran. Second, low oil prices and U.S. sanctions have damaged Iran’s economy to the point where it can no longer spend the funds necessary to maintain influence in Syria. If this trend continues, Russia and Turkey will vie for domination of Damascus. The Iraqi government has stopped payments to the Kurdistan Regional Government. Between the loss of these funds and lower oil prices, the Kurdistan government is near collapse. If it fails, we would not be surprised to see Turkey try to expand its influence. Most of the Gulf Cooperation Council states peg their currencies. This action brings stability and allows these nations, which often import nearly all their consumer goods, to maintain low prices. However, the decline in oil prices has raised fears that devaluations may be in the offing. If so, it could raise internal tensions in these countries.
In Part I of this report, we discussed Scheidel’s thesis on the events that reverse the normal trend of inequality and used this analysis to frame the COVID-19 pandemic. In Part II, we introduced the equality/ efficiency cycle and discussed the first issue that would be affected by a shift to equality. In this final Part III of the report, we will address the other four issues, discuss inflation and conclude with market ramifications.
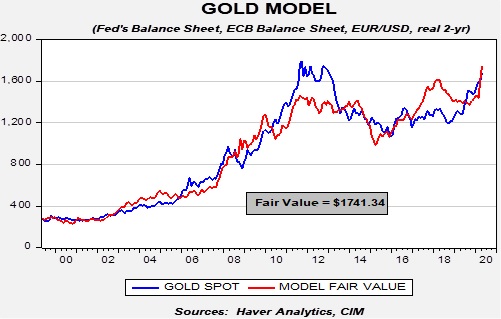
The policy response to COVID-19 has been mostly favorable for gold. Our gold model uses the balance sheets of the Federal Reserve and the European Central Bank, the EUR/USD exchange rate, and the real two-year T-note yield. The only variable that has been bearish for gold is the dollar, but the massive rise in central bank balance sheets and the drop in real yields has lifted the model’s fair value to 1,741.34.
In the coming months, we expect the fair value to rise; both the ECB and the Federal Reserve are likely to continue to expand their balance sheets, adding a broad spectrum of assets. We would also expect some modest declines in the real two-year T-note yield as inflation rises. Weakening the dollar may require direct action by the administration. Although this action may not occur this year, we would not be shocked to see it occur at some point in the future.
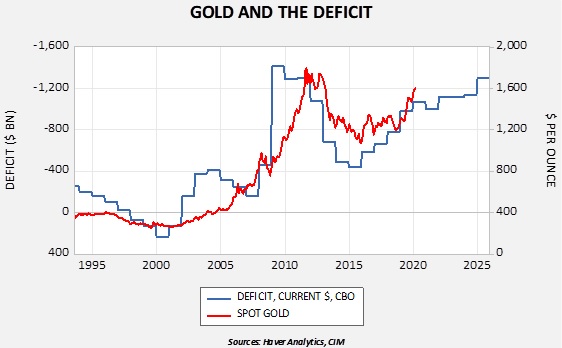
In addition, there is a long-term relationship between gold prices and the level of the fiscal deficit. Although the level of the current deficit does suggest that gold prices might be a bit overvalued currently, the likelihood of expanding deficits should offer underlying support for gold prices. The Congressional Budget Office recently increased its deficit forecasts; we still view them as conservative and would anticipate even higher deficits due to falling tax receipts and rising spending.
Therefore, our short- and long-term outlooks for gold remain positive.
by Bill O’Grady, Thomas Wash, and Patrick Fearon-Hernandez, CFA
Here is an updated crude oil price chart. The oil market is showing signs of trying to consolidate in the mid-teens.
(Source: Barchart.com)
Oil prices continue to be affected by ETPs. The most popular ETP for crude oil, the United States Oil Fund, (USO, 17.91), has changed its investing procedures, now holding more contracts in the deferred calendar strip. The good news is that it is no longer so closely tied to the nearby contract and is thus less susceptible to price collapses and less affected by the roll yield issue. The bad news is that it is no longer a “play” on the nearby price of oil but is mostly now a position in the average price over several months. If this process continues, it should become less volatile in the future; on the other hand, if the market becomes backward at some point, it will underperform the nearby price. We also note it has engineered an 8:1 reverse stock split. U.S. investors are not the only parties to oil market turmoil. The Bank of China[1] (BACHY, 9.41) reports that its clients lost $1.0 billion on bullish oil positions. The Industrial and Commercial Bank of China (IDCBY, 13.43), the largest commercial bank in China by assets, has halted the sale of retail products in oil and gas.
Crude oil inventories rose 9.0 mb compared to the forecast rise of 12.7 mb.
In the details, U.S. crude oil production fell 0.1 mbpd to 12.1 mbpd. Exports rose 0.4 mbpd, while imports rose by the same amount. Refining activity rose 2.0%, a bit more than the 1.2% rise forecast. The inventory build was mostly due to continued elevated U.S. production.
(Sources: DOE, CIM)
The above chart shows the annual seasonal pattern for crude oil inventories. The last five weeks have pushed stockpiles almost “off the charts.” Although not totally unexpected, the current rise is at least consistent with the usual seasonal pattern; in early June, the divergence in seasonal patterns will become stark.[2]
Based on our oil inventory/price model, fair value is $30.66; using the euro/price model, fair value is $44.62. The combined model, a broader analysis of the oil price, generates a fair value of $37.26. As we noted recently, the model output is less relevant as there is a non-linearity tied to the loss of storage capacity that cannot be fully captured with these models, which has been clearly exhibited over the past week.
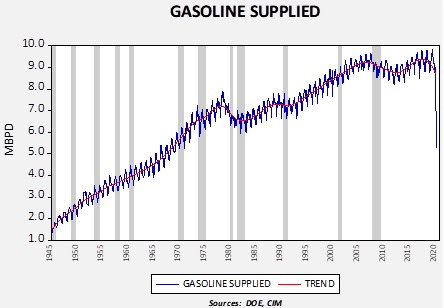
Here is a longer look at gasoline consumption.
This chart shows the amount of gasoline supplied to the U.S. since the end of WWII on a monthly basis. We have generated a trendline for the data. Until the 1979 Iran Crisis and the outbreak of the Iran-Iraq War, the trend in gasoline consumption moved relentlessly higher, even during recessions. There was a modest dip during the Gulf War in the 1990-91 recession and another decline in trend in the Great Financial Crisis. However, it is clear that what we are experiencing now has no historical comparison in the postwar era. We would expect a recovery to develop in the coming months, but the decline in consumption is extreme and will tend to weigh on the oil markets for months, at least.
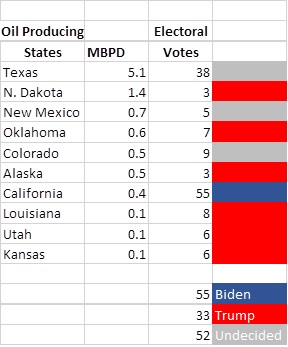
It is becoming clear that the federal government is probably not going to rescue the oil industry. The industry itself is divided, with the larger firms preferring to see smaller firms fail, allowing the larger firms to purchase their assets at depressed levels. Production levels are slowly falling. Although numerous proposals have been floated, opposition to the oil industry from the left, both establishment and populist, means passing support measures through Congress will be quite difficult. The best way to think about it is that political leaders, both at the White House and in Congress, have a limited amount of political capital. They want to spend it judiciously and get as much political support for the political capital they expend. It does look like the White House wants to support the oil industry but isn’t willing to use a lot of political influence (capital) to pay for that support. This table shows the top 10 oil-producing states along with their votes in the Electoral College and poll leanings from Real Clear Politics.
The last time Texas voted for a Democrat for president was Jimmy Carter in 1976. We would be surprised to see it flip this election, even if an oil bailout isn’t forthcoming.
Venezuela has a new oil minister. Tareck El Aissami has been appointed to the position by President Maduro. El Aissami replaces Gen. Manuel Quevedo, who has had the job for 28 months. Quevedo was also in charge of PDVSA, the state oil company; he lost that job too, being replaced by Asdrubal Chavez, the cousin of the late President Hugo Chavez. There is speculation that El Aissami, who is of Lebanese descent, may signal closer ties to Iran. It should also be noted that the U.S. has a $10 million reward for the arrest of El Aissami.
Although there are expectations that Saudi Arabia is preparing to cut output, Russia reported that its March oil exports to China rose 31% from last year, while Saudi imports fell 1.6%. Our thesis is that the two nations are fighting a market share war for the Chinese market; this news might reduce Riyadh’s ardor for cutting output.
It’s not just the oil industry that has been hit by low oil prices. Corn farmers are facing a drop in demand for ethanol, which will tend to undermine demand for the grain. The after-product of distilled corn, distillers grain, means that corn distilled into ethanol isn’t completely consumed by the industry. Thus, if cattle demand improves, farmers will still have a market for their corn; exports would also help. Still, the loss of ethanol demand is a problem for farmers.
Our current outlook is that oil prices will continue to hold in the teens for the next month or so and gradually improve in the coming months. The primary risk to oil remains the exhaustion of storage capacity, but we should see improving demand and supply curtailments eventually begin to allow prices to recover. The speed of the recovery will be partly dependent on reducing the current storage overhang, which will take months. Nevertheless, barring a situation where there is absolutely no storage to be utilized, another drop into single-digit prices is becoming less likely.
[1] Not the central bank of China, known as the People’s Bank of China, or PBOC
[2] Regular readers may notice the average is a bit different in this chart. We had a data issue which has been resolved. The overall pattern hasn’t changed, however.
In Part I, we introduced Walter Scheidel’s four horsemen and examined the impact of COVID-19 using his framework.[1] This week, we introduce the equality/ efficiency cycle and discuss the first issue that would be affected by the reversal of this cycle.
COVID-19 and the Equality/Efficiency Cycle
We postulate that economies pass through cycles of equality and efficiency. We developed this concept based on the seminal work of three scholars. The first strand is the idea of the equality/efficiency tradeoff, which comes from Arthur Okun.[2] He argued that societies face a tradeoff between equality and efficiency. Efficiency is necessary for growth, while equality is required for political and social stability. However, there is no evidence that Okun saw this tradeoff as a cycle; instead, he saw it as two competing forces to be constantly balanced.
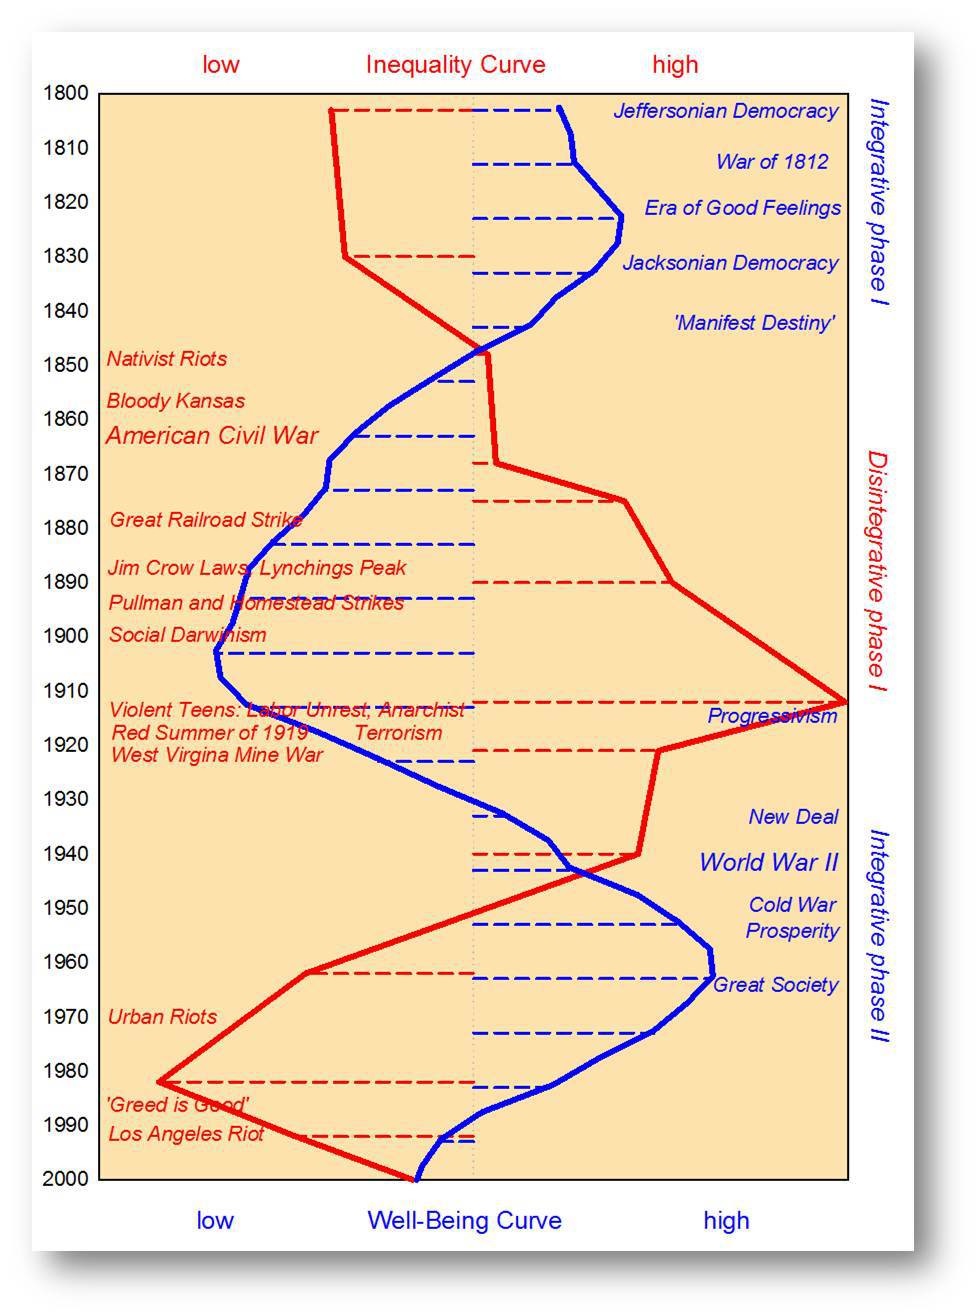
The second source of our postulate is from Peter Turchin, who suggested that countries cycle between periods of greater or lesser equality. In the following chart, Turchin shows this cycle in the U.S. from the early 1800s to 2000. Measuring inequality (red line) is a simple calculation that originated with Kevin Phillips. It is the ratio of the largest fortune in the U.S. relative to average household wealth. The well-being line (blue line) is the detrended and log-transformed level of social optimism, which is the average age of marriage, along with the wages of production workers divided by per-capita GDP, life expectancy and average height. The chart shows that well-being is inversely correlated to inequality.
The third source of our thesis comes from Walter Scheidel, who suggests that efficiency cycles are the norm due to the power of capital. Efficiency continues until it is stopped by one of four major disruptions: mass mobilization war, revolution, societal collapse or pandemic.
Therefore, our thesis is the following:
Societies face a tradeoff between equality and efficiency.
This tradeoff leads to cycles in which the goals of one or the other dominate.
The natural course is for efficiency to dominate because capital tends to accumulate economic and political power over time.
What reverses the dominant trend is a cataclysmic event, i.e., mass mobilization war, revolution, collapse of social order, pandemic.
What reverses an equality cycle is persistent inflation, which is usually supported by equality policies of trade impediments, immigration control and regulation.
[1] Scheidel, Walter. (2017). The Great Leveler: Violence and the History of Inequality from the Stone Age to the Twenty-First Century. Princeton, NJ: Princeton University Press.
[2] Okun, Arthur. (1975). Equality and Efficiency: The Big Tradeoff. Washington, D.C.: Brookings Institution Press.
As the COVID-19 pandemic continues to evolve, we are watching to see how the disease will affect the economy longer term. Of course, projections of this sort are highly probabilistic; factors could and will likely emerge that could render these projections irrelevant. At the same, ignoring potential long-term consequences of the virus could lead to improper decisions, failing to fully appreciate the changes the disease has caused.
In this week’s report, we will look at demographics. Demographic analysis is important because it is a “deep background” of what affects markets. Demographic change tends to occur slowly but can be rather easily forecast far into the future. Thus, if a variable is sensitive to changes in the population, it can be rather simple to forecast trends well into the future.
The baby boom, encompassing Americans born during 1946-64, has always been the “pig in the snake” for demographers. When this generation reached school age, the number of elementary enrollments jumped. Later, in the mid-1970s, enrollment fell and led to empty school buildings.
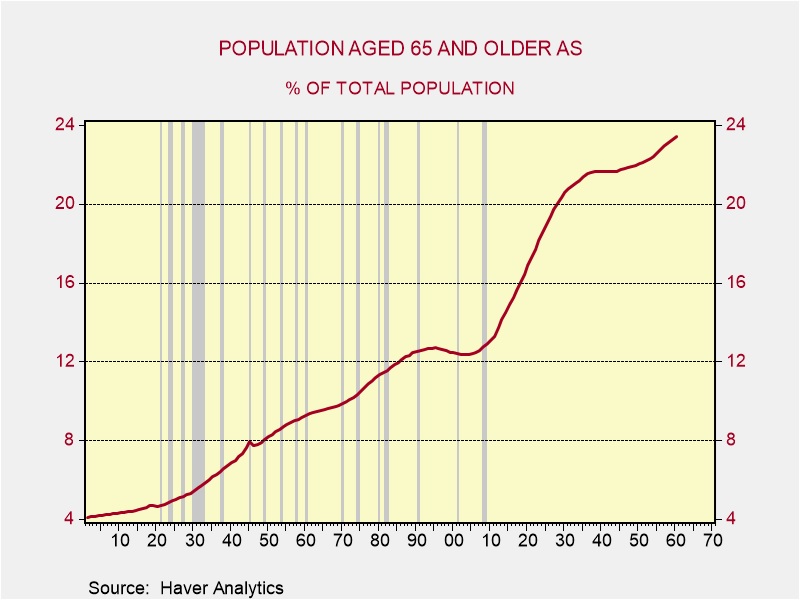
The current age range for the baby boom is 56 to 74. In another seven years, this entire generation will reach retirement age. The chart below shows that the population share 65 years and older is set to rise rapidly for the next two decades. Demographers for years have been warning that the mass retirement of this generation would cause problems in the labor market, predicting that employers would be scrambling to fill positions.
That hasn’t happened yet for a number of reasons—globalization has allowed firms to tap labor resources abroad, immigration has offset some of the retirement numbers, and baby boomers have continued to work longer.
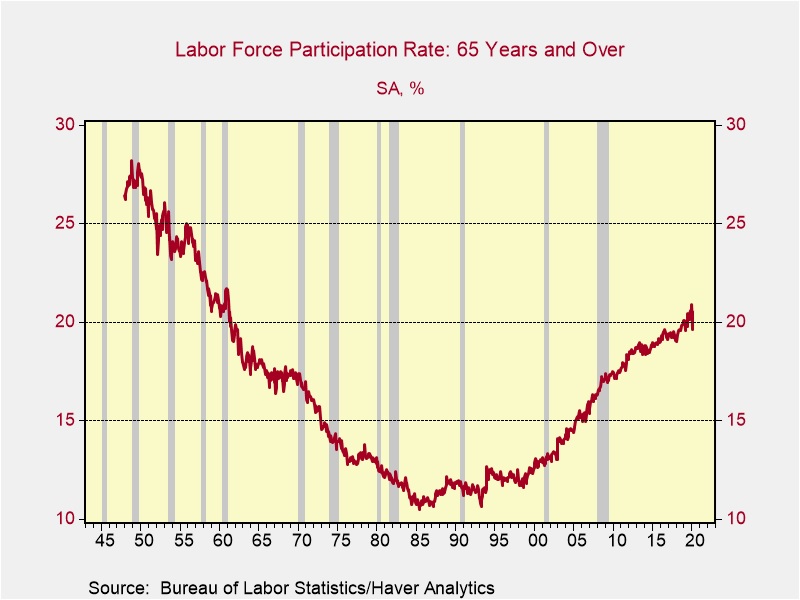
At the turn of the century, the participation rate[1] was around 12.5%. It has steadily increased to over 20%, although it has recently declined. Essentially, baby boomers, which include nine years of this group, appear to have remained in the labor force. We suspect there are two reasons. First, as life expectancies have increased, wealthier boomers, who are probably healthy, likely wanted to remain working. Second, less affluent boomers probably needed to keep working as long as possible due to the lack of retirement saving.
COVID-19 could reverse this participation trend. The fatality rate of the virus tends to rise with age. Older workers who have stayed in the labor force may decide that the threat of infection is too high and thus opt to retire. If a broad-spectrum vaccine is developed, this potential trend could be thwarted, but if COVID-19 mutates like influenza and requires an annual vaccination of varying effectiveness, a vaccine might not be enough to prevent older workers from exiting the workforce. A decline in older worker participation would reduce the labor force; if that action occurs along with restrictions on immigration and trade impediments, all tenets of deglobalization, we would expect the labor share of national income to rise.
[1] The participation rate is the labor force (employed + unemployed seeking employment)/population eligible to be in the labor force.
We use cookies to ensure that we give you the best experience on our website. If you continue to use this site we will assume that you are happy with it.