

Weekly Energy Update (April 30, 2020)
by Bill O’Grady, Thomas Wash, and Patrick Fearon-Hernandez, CFA
Here is an updated crude oil price chart. The oil market is showing signs of trying to consolidate in the mid-teens.

Oil prices continue to be affected by ETPs. The most popular ETP for crude oil, the United States Oil Fund, (USO, 17.91), has changed its investing procedures, now holding more contracts in the deferred calendar strip. The good news is that it is no longer so closely tied to the nearby contract and is thus less susceptible to price collapses and less affected by the roll yield issue. The bad news is that it is no longer a “play” on the nearby price of oil but is mostly now a position in the average price over several months. If this process continues, it should become less volatile in the future; on the other hand, if the market becomes backward at some point, it will underperform the nearby price. We also note it has engineered an 8:1 reverse stock split. U.S. investors are not the only parties to oil market turmoil. The Bank of China[1] (BACHY, 9.41) reports that its clients lost $1.0 billion on bullish oil positions. The Industrial and Commercial Bank of China (IDCBY, 13.43), the largest commercial bank in China by assets, has halted the sale of retail products in oil and gas.
Crude oil inventories rose 9.0 mb compared to the forecast rise of 12.7 mb.
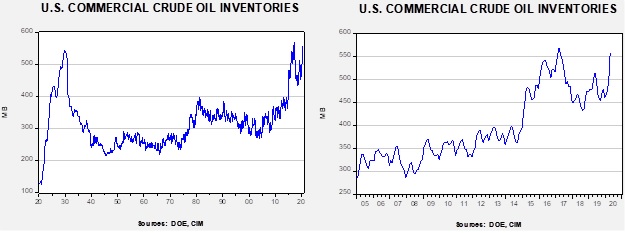
In the details, U.S. crude oil production fell 0.1 mbpd to 12.1 mbpd. Exports rose 0.4 mbpd, while imports rose by the same amount. Refining activity rose 2.0%, a bit more than the 1.2% rise forecast. The inventory build was mostly due to continued elevated U.S. production.
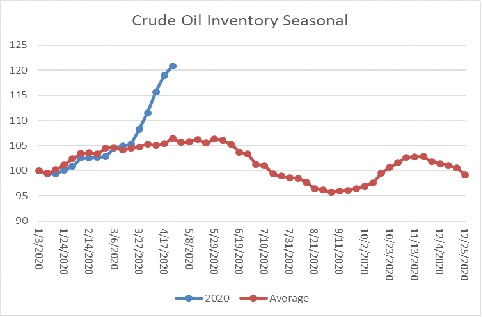
The above chart shows the annual seasonal pattern for crude oil inventories. The last five weeks have pushed stockpiles almost “off the charts.” Although not totally unexpected, the current rise is at least consistent with the usual seasonal pattern; in early June, the divergence in seasonal patterns will become stark.[2]
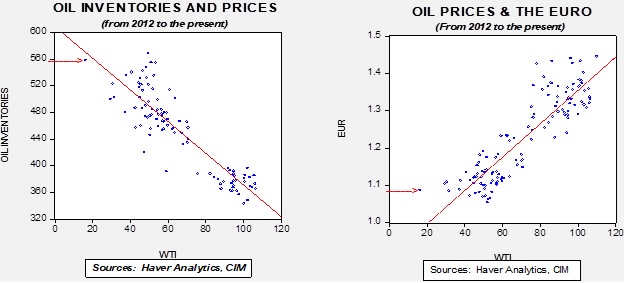
Based on our oil inventory/price model, fair value is $30.66; using the euro/price model, fair value is $44.62. The combined model, a broader analysis of the oil price, generates a fair value of $37.26. As we noted recently, the model output is less relevant as there is a non-linearity tied to the loss of storage capacity that cannot be fully captured with these models, which has been clearly exhibited over the past week.
Here is a longer look at gasoline consumption.
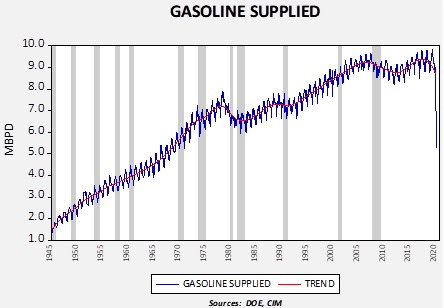
This chart shows the amount of gasoline supplied to the U.S. since the end of WWII on a monthly basis. We have generated a trendline for the data. Until the 1979 Iran Crisis and the outbreak of the Iran-Iraq War, the trend in gasoline consumption moved relentlessly higher, even during recessions. There was a modest dip during the Gulf War in the 1990-91 recession and another decline in trend in the Great Financial Crisis. However, it is clear that what we are experiencing now has no historical comparison in the postwar era. We would expect a recovery to develop in the coming months, but the decline in consumption is extreme and will tend to weigh on the oil markets for months, at least.
It is becoming clear that the federal government is probably not going to rescue the oil industry. The industry itself is divided, with the larger firms preferring to see smaller firms fail, allowing the larger firms to purchase their assets at depressed levels. Production levels are slowly falling. Although numerous proposals have been floated, opposition to the oil industry from the left, both establishment and populist, means passing support measures through Congress will be quite difficult. The best way to think about it is that political leaders, both at the White House and in Congress, have a limited amount of political capital. They want to spend it judiciously and get as much political support for the political capital they expend. It does look like the White House wants to support the oil industry but isn’t willing to use a lot of political influence (capital) to pay for that support. This table shows the top 10 oil-producing states along with their votes in the Electoral College and poll leanings from Real Clear Politics.
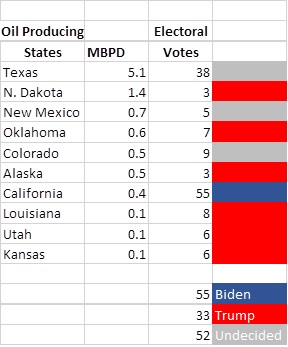
The last time Texas voted for a Democrat for president was Jimmy Carter in 1976. We would be surprised to see it flip this election, even if an oil bailout isn’t forthcoming.
Venezuela has a new oil minister. Tareck El Aissami has been appointed to the position by President Maduro. El Aissami replaces Gen. Manuel Quevedo, who has had the job for 28 months. Quevedo was also in charge of PDVSA, the state oil company; he lost that job too, being replaced by Asdrubal Chavez, the cousin of the late President Hugo Chavez. There is speculation that El Aissami, who is of Lebanese descent, may signal closer ties to Iran. It should also be noted that the U.S. has a $10 million reward for the arrest of El Aissami.
Although there are expectations that Saudi Arabia is preparing to cut output, Russia reported that its March oil exports to China rose 31% from last year, while Saudi imports fell 1.6%. Our thesis is that the two nations are fighting a market share war for the Chinese market; this news might reduce Riyadh’s ardor for cutting output.
It’s not just the oil industry that has been hit by low oil prices. Corn farmers are facing a drop in demand for ethanol, which will tend to undermine demand for the grain. The after-product of distilled corn, distillers grain, means that corn distilled into ethanol isn’t completely consumed by the industry. Thus, if cattle demand improves, farmers will still have a market for their corn; exports would also help. Still, the loss of ethanol demand is a problem for farmers.
Our current outlook is that oil prices will continue to hold in the teens for the next month or so and gradually improve in the coming months. The primary risk to oil remains the exhaustion of storage capacity, but we should see improving demand and supply curtailments eventually begin to allow prices to recover. The speed of the recovery will be partly dependent on reducing the current storage overhang, which will take months. Nevertheless, barring a situation where there is absolutely no storage to be utilized, another drop into single-digit prices is becoming less likely.
[1] Not the central bank of China, known as the People’s Bank of China, or PBOC
[2] Regular readers may notice the average is a bit different in this chart. We had a data issue which has been resolved. The overall pattern hasn’t changed, however.