

Asset Allocation Weekly (May 8, 2020)
by Asset Allocation Committee
The U.S. economy has been hit with shelter-in-place orders that have depressed consumption and reduced production. The economic readings on Q2 will be historically bad, perhaps even worse than the Great Depression. However, based on the assumptions that (a) aggressive policy support will continue, and (b) the pandemic will wane over time, either due to natural herd immunity or medical intervention, financial markets are assuming the impact of COVID-19 will be severe in impact but short in duration. Although we mostly agree with that assessment, the rebound has much to do with how GDP is reported. The common way is to annualize the quarterly change. Thus, if we get a large decline in Q2, a very modest rise in GDP in Q3 will tend to look quite large. This is not the only way to measure the change in GDP. The year-on-year change will look less onerous in Q2 but won’t look as impressive in Q3.
Another way we like to look at the GDP data is against its long-term trend. To forecast Q2 GDP, we are taking advantage of a new high-frequency index created by the New York FRB. The index is designed to measure the yearly change in GDP—how much GDP has changed compared to Q2 2019. It is currently forecasting about a 12% yearly change.[1] We can then take that number and calculate what the level of GDP looks like compared to its long-term trend.
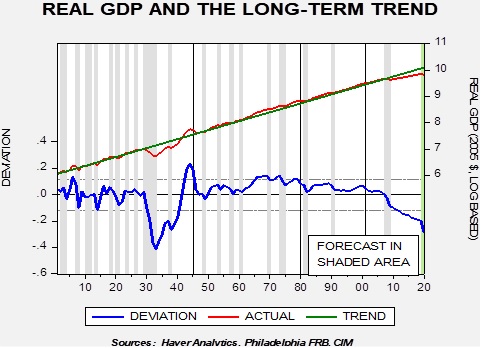
To generate this chart, we log-transform real annual GDP and regress a time trend through the data. The important line is the lower deviation line. There are two periods when GDP was well below trend; the Great Depression and the post-Great Financial Crisis to the present. The Great Depression showed a massive drop in the level of GDP that took until 1942 to return to trend. Although fiscal and monetary policy were expanding after 1932, it took war spending to finally bring the economy back to trend. What has been disconcerting about the past expansion is that it was much slower than the long-term trend. And so, the level of GDP continued to fall compared to trend; our estimate for GDP in the COVID-19 recession shows a downleg in growth that is rivaling levels seen in 1935.
The point of this analysis is that the trend should represent some degree of capacity. It is possible the trajectory for GDP that held from 1901 to 2008 is no longer possible. But, if that trendline does represent a normal level for GDP, it would suggest the economy can absorb aggressive fiscal and monetary policy expansion before inflation becomes a problem. If inflation starts to rise before the trendline is achieved, it would confirm that the trendline is no longer valid; however, for the political class, it would seem natural to find out if the long-term trend line remains a measure of capacity. In other words, we would expect even more deficit spending and easy monetary policy until inflation returns. Given how far GDP remains below trend, the return of inflation may take a rather long time.
[1] Although this is not the focus of this report, the forecast level of decline is consistent with a 35% drop in annualized GDP in Q2.