by the Asset Allocation Committee | PDF
- We believe that we are now in an economic recovery which we expect to be long and slow moving.
- The Federal Reserve will likely continue to be aggressively accommodative, as will other global central banks, providing a favorable backdrop for equities.
- With an accommodative Fed, we retain elevated relative weightings to equities, yet exposures in the strategies have shifted toward an emphasis on cyclical stocks.
- Given the upcoming U.S. elections and the accompanying uncertainty of policies in its wake, we initiated a position in non-U.S. equities. Their favorable valuations and the potential for a softening in the exchange rate for the U.S. dollar make them attractive for U.S.-based investors.
- Exposure to gold is retained in each of the strategies given its ability to act as a hedge against geopolitical risks and for its appreciation potential due to global central bank accommodation and in the event of a decline in the exchange rate of the U.S. dollar.
ECONOMIC VIEWPOINTS
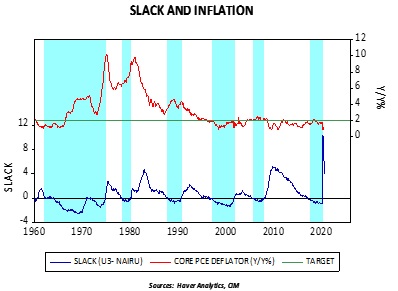
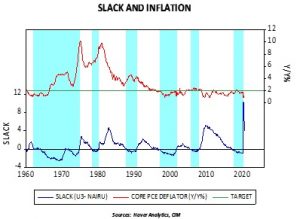
Although the upcoming U.S. elections have captured extraordinary attention, whether the nation swings red, blue, or purple is of nominal consequence to equity and debt markets beyond near-term swings. Rather, our forecast rests upon the principal pillar that the U.S. has now entered a recovery, albeit a long and protracted one. We are expecting a sizable bounce in the Q3 GDP print off the jarring Q2 number, followed by low yet steady growth. While a number of publications have offered alphabetic depictions of the economy, such as V-shaped, U-shaped, W-shaped, and L-shaped, our view is that it will resemble a square root sign. The aggressive accommodation by the Fed will be helpful, as will any further fiscal stimulus measures. The Fed’s pronouncement following its virtual Jackson Hole meeting at the end of August that it will unbind its hard 2% inflation target in favor of attempting to average this level over time is a marked change, yet will likely have no perceptible impact within our three-year forecast period. Similarly, the Fed has stated its intention of no longer using low unemployment as an indicator of potential inflation. As the accompanying chart illustrates, the level of slack in labor had been useful as a gauge of inflation last century but has been of spurious utility over the past 25 years. While these two policy changes are noteworthy, we find the likelihood for the Fed to engage in a form of yield curve control and leave fed fund rates mired near the zero bound through next year and potentially beyond to be of greater consequence and should be supportive of the economy and markets.
A near-term risk to the stock market is the potential for a presidential election where there is no clear winner. This could cause a significant, though short-term, negative event. Although we believe that over our entire forecast period the support offered by the Fed and market sentiment will be positive for risk assets, our recognition of the possibility of market disruption over the next few months encourages our continued use of gold as well as the introduction of non-U.S. developed market equities and long-term Treasuries, where risk appropriate, to serve as a partial containment for this scenario.
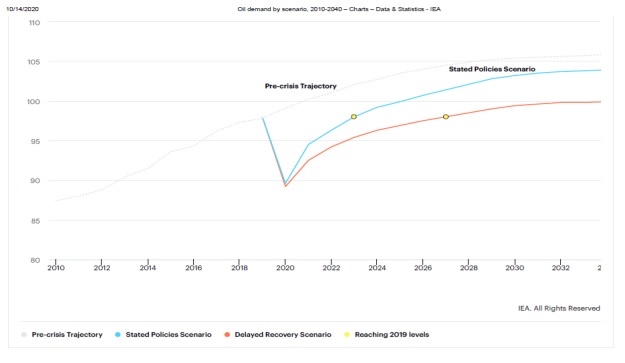
Looking beyond the U.S., global economic indicators paint a similar portrait to that of the U.S., as one would expect given the reach of COVID-19. The recently released World Economic Outlook by the IMF provided modestly improved expectations for global growth, though unevenly applied. As examples, China is certainly ahead of the rest of the world in terms of the dynamics brought about by COVID-19 and could be the sole major economy that records positive growth this year, the EU and U.K. are potentially facing a hard Brexit at year-end which carry realignment implications, and the new Prime Minister in Japan is examining new methods to bring inflation to target and boost domestic consumption. Overall, however, the world appears to be recovering from the economic ravages of the disease and the forecast over the next three years is encouraging.
STOCK MARKET OUTLOOK
Although our forecast is for low, steady growth, we believe the Fed’s continual support will be positive for stocks. Some have accused the Fed of engaging in volatility suppression, and we see no change in direction at this juncture. With inflation dormant, household balance sheets being repaired, and consumer demand increasing, especially as we work through and beyond COVID-19, we anticipate attractive returns for stocks over our three-year forecast period. Over the next couple months, however, there is potential for volatility to spike should there not be a clear victor in the U.S. presidential election. Nevertheless, as we showed in the chart in last quarter’s edition of this publication, the longer-term return differential for stocks between an incumbent Republican being reelected or a Democratic challenger being elected is marginal. Though there will be clear leaders and laggards among companies, industries, and sectors given changes in policies, the overall stock market is more affected by economic activity and monetary policy than by political victors.
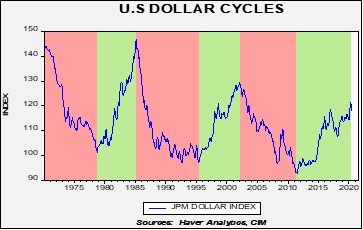
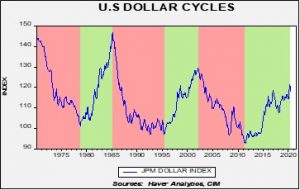
Given our positive outlook, we remain relatively overweight equities. Within equities, however, we made several changes to geographic, sector, and industry exposures. The allocations to U.S. mid-cap equities were reduced in favor of introducing exposure to non-U.S. developed market stocks. Not only does this change shield against potential short-term volatility that could be created by a contested U.S. presidential election, but it also stands to benefit over our forecast period through the combination of attractive relative valuations and the potential for a weakening in the exchange rate of the U.S. dollar. The European Union’s proposed issuance of €750 billion in bonds to fund its COVID-19-related recovery program may be the catalyst that makes the euro a complementary currency, thereby ending the dollar’s ascendant cycle that has prevailed since the Great Financial Crisis. For U.S.-based investors, dollar weakness produces a very strong tailwind for returns on foreign stocks. This extends to emerging markets stocks as valuations are attractive and a resurgent Chinese economy holds enormous potential for other emerging markets that contribute to the global supply chain. The stimulus measures by the Chinese government adopted at the beginning of the summer are already having an effect and its economy is expected to exhibit positive growth in 2020.
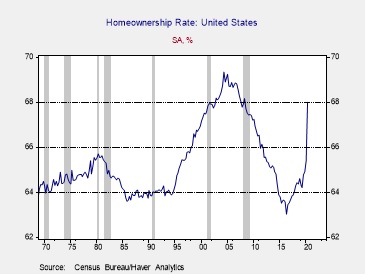
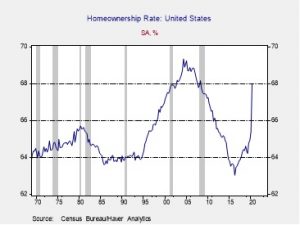
Within the U.S., we emphasize cyclical stocks in the strategies and remove the tacit tilt toward growth. The sector overweights to Technology and Communication Services have been replaced by overweights to Industrials and Materials. The overweight to Consumer Discretionary that was introduced at the end of March remains. The strategies also have dedicated exposure to the housing sector. Our belief is that the strength of this segment will remain durable throughout the forecast period given the demographic demand.
BOND MARKET OUTLOOK
We expect the historically low yields and spreads on corporate bonds to prevail over the next three years as the Fed remains ultra-accommodative and supportive of the corporate bond market. Within that ultra-accommodative posture, we expect the Fed to exert a form of yield curve control, possibly out to the 10-Year maturity, as a form of financial repression. We further anticipate that the large-scale asset purchases of Treasuries and agencies will continue as a form of unlimited quantitative easing and that, as necessary, the Fed will backstop the corporate bond market, including some elements of speculative grade bonds. Consequently, spreads should remain close to current levels and could moderately tighten. As noted previously, comments by the Fed following its virtual Jackson Hole meeting are that it will no longer try to rein in inflation if it runs hot for several months and will not be utilizing low unemployment numbers as a harbinger of inflation. These policies are now established and will be followed regardless of the resident of the White House or the makeup of the legislature. Accordingly, we are likely to be range-bound over the course of our three-year forecast period. However, increasing debt issuance by the Treasury, agencies, and corporations could lead to oversupply and problems down the road for the Fed’s attempt to backstop the shadow banking system.
The strategies with income as an objective remain positioned with a laddered bond core and with exposure to agency mortgage-backed securities and a general overweight to corporate bonds. Although we believe the bond market will prove transcendent regarding the upcoming election, where it is risk appropriate, we have employed zero-coupon long-term Treasuries to provide a stabilizer over the next quarter in the event of elevated election-related equity market volatility.
OTHER MARKETS
As with the prior quarter, our expectations for REITs is that they will earn their dividend in the aggregate. Cell towers, data centers, and storage will offset weakness exhibited by the office/retail segment, which represents less than 20% of the REIT index. We maintain that REITs provide a varied and diversified source of income and are consequently utilized in strategies where income is a component.
Gold has been incorporated across all strategies since the fourth quarter of last year and continues to maintain a healthy allocation. It remains an important diversifier against heightened geopolitical risk and will benefit as central banks across the planet continue to be accommodative. Given the substantive move in silver last quarter, we elected to remove it from the more conservative strategies as its price appreciation caused the gold/silver ratio to move closer to its mean. However, we retain silver in strategies designed for growth as we believe it is risk appropriate and its industrial uses make it attractive in an economic recovery.
Read the full report