

Asset Allocation Weekly (December 18, 2020)
by Asset Allocation Committee | PDF
(N.B. Due to the upcoming holiday season, this report will be the last Asset Allocation Weekly for 2020. The next report will be published on January 8, 2021.)
While 2020 was a year in which the word “unprecedented” has been used a lot, there are many areas where the term is appropriate. One area of interest is in the growth of liquidity. The chart below is one we have featured often, showing retail money market fund levels (RMMK) and the S&P 500.
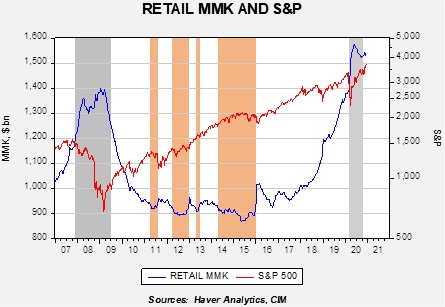
The gray bars show recessions, while the orange bars show periods where RMMK fell below $920 billion. Our position has been that when we are in the orange parts of the chart, there is a dearth of liquidity and equity markets tend to stall. On the other hand, periods of rapid RMMK accumulation have tended to be periods of equity weakness.
In 2018, as the trade war escalated, RMMK began to rise sharply. It continued to rise throughout 2019 into 2020. The pandemic led to another leg higher in RMMK. The level of RMMK has fallen from the highs set earlier in the year but it remains elevated. As noted above, when RMMK rises sharply, equities tend to suffer. We did see some evidence of that in 2018, but last year equities continued to trend higher despite the rise in RMMK. Pandemic worries and a brewing financial crisis led to a sharp selloff in the S&P 500, but the market turned as policymakers moved quickly to support the economy.
It is clear that the level of RMMK is high, but the difficulty is determining “how high.” For that, analysts usually try to scale the data to make it comparable across periods. A logical scale variable may be in comparing the level of RMMK to household financial assets. The problem with that variable is that it is very sensitive to the level of equities; in other works, cash levels seem to rise coincident with a fall in equity values. Most of the decline occurs due to the fall in equity values, not to cash accumulation. The other problem with scaling is finding the answer to the question at hand. What we want to know is if RMMK levels fall, will the funds go to stocks or elsewhere? We assume that RMMK is the closest asset to equities of fixed income; in other words, demand or savings deposits probably represent the desire to hold cash, whereas RMMK is where liquidated financial assets go before they are placed elsewhere.
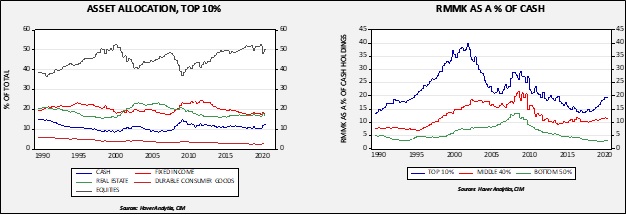
The chart on the left shows the asset allocation of the top 10% of households. Note that about 50% of this income group’s assets are in equities. That is far larger than the middle income group (89% to 51%), which holds 25% in equities, and the bottom 50%, which has equity holdings of 10%. The chart on the right shows that the RMMK holdings for the top 10% group rose from 15% to near 20% from 2018 to 2020, coinciding with the rise in RMMK shown in the first chart.
These charts suggest that most of the RMMK accumulation occurred in an income group most inclined to buy equities. Accordingly, the elevated level of RMMK should be supportive for equities. At the same time, in 2008, RMMK held by the top 10% reached nearly 30%. Thus, we may not see as large of a recovery as we saw during 2009-11. Still, there does appear to be ample liquidity available for stocks, and given the low level of interest rates, flows should continue to be supportive for equities.