by Asset Allocation Committee | PDF
Jan Tinbergen was a Dutch economist, the first to win the Nobel Prize for economics[1] for his work on applied dynamic models of economic processes. Perhaps his most important contribution to economic policy is the penning of the Tinbergen Rule, which states that policymakers need an equal number of policy tools for each policy goal. If policymakers violate the Tinbergen Rule, they can leave a policy goal unaddressed. Of course, there are circumstances where two goals are solved with one policy tool, but that does require some degree of good fortune. Relying on luck is usually not a solid plan.
The classic case of the Tinbergen problem is the use of monetary policy to meet both inflation and full employment targets.
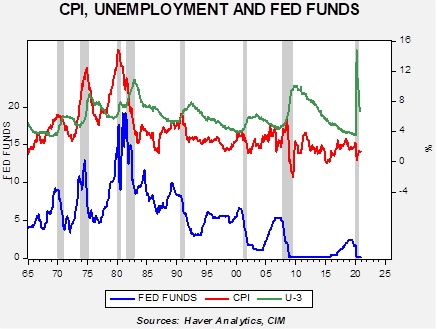
This chart shows the unemployment rate and CPI on the upper part of the graph and fed funds on the lower part. History shows that the FOMC mostly pays attention to inflation when setting policy and only reacts to rising unemployment when recessions occur. To some extent, the unemployment rate only rises when a recession is imminent, which is the idea behind the Sahm Rule. From 1965 into the early 1980s, there was a clear “whipsaw” in policy. Rapidly rising inflation tended to lift the fed funds rate. As unemployment began to rise, policymakers faced a dilemma—do they cut rates to help the economy but risk higher inflation, or do they focus on inflation and risk rising unemployment?
Since the early 1980s, this dilemma has mostly been resolved. Inflation has been low and mostly steady, which allows for the FOMC to focus on unemployment. And, the inflation problem was mostly fixed by regulatory policy; globalization and deregulation reduced price pressures, meaning that policymakers had two tools—interest rates combined with globalization and deregulation—to deal with two policy goals, low inflation and full employment. Thus, the Tinbergen Rule was satisfied.
However, these two goals are not the only ones that the FOMC and other policymakers are concerned about. Financial market stability is another one. Clearly, we have seen the impact of regulatory policy changes on monetary policy.
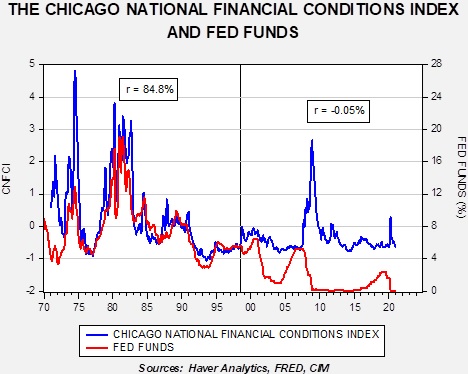
This chart shows the National Financial Conditions Index, created by the Chicago FRB, and fed funds. From the early 1970s into mid-1998, the correlation was very close. In fact, one could argue that the FOMC either adjusted policy to financial stress levels, conducted policy with little regard to stress, or actually targeted stress as a policy tool. Because the financial system was generally more regulated until the late 1990s, Fed policymakers worried less about financial conditions. But, since Gramm-Leach, which essentially created conditions where commercial banks could freely operate in the non-bank financial system, the FOMC has clearly shifted the relationship on monetary policy and financial conditions. Now, the Fed finds itself in a situation where financial conditions are mostly immune to the policy rate. When a financial crisis emerges, it seems to require aggressive easing and accommodative policy for extended periods to bring calm back to the markets.
Lately, the Fed has faced criticism from commentators arguing that persistently low rates and balance sheet expansion have contributed to financial excesses. Although we would agree with these comments, it should be noted that the Fed is facing a Tinbergen problem. It has only one policy tool, interest rates, to reduce unemployment and maintain financial stability. Raising rates would likely contract the P/E but there is little reason to expect that increased rates would reduce unemployment. What the Fed needs is an additional policy tool, something akin to Glass-Steagall, to reduce the liquidity available for the purchase of financial assets. Since that outcome isn’t likely, we expect financial assets to remain supported.
View PDF
[1] Strictly speaking, there is no Nobel Prize for economics. Its official title is the “Sveriges Riksbank Prize in Economic Sciences in Memory of Alfred Nobel.” He shared the prize with Ragnar Frisch.