Asset Allocation Bi-Weekly – The Selling of Austerity (June 27, 2022)

by the Asset Allocation Committee | PDF

Politics is the art of the possible…

Otto Von Bismarck

Although there have been attempts to treat it as a science (hence the study of political science), the necessary art of politics is to convince people to accept policies that may be contrary to their best interest.  This quote sums up the problem succinctly.

We all know what to do, but we don’t know how to get re-elected once we have done it.

Jean-Claude Juncker

Policy actions are sold.  Merely telling the public that a difficult policy mix is necessary doesn’t work very well.  So, policymakers create narratives to justify and explain why something difficult won’t be all that bad or won’t affect anyone you know.  For example, higher taxes on upper-income households are packaged as “paying one’s fair share.”  Windfall profit taxes are there to “share the pain.”

The Federal Reserve faces a similar problem.  Merely indicating that policy needs to be tightened is unpopular.  So, major policy changes must be couched in a manner that the public will accept.  Alan Greenspan realized that monetary policy could reduce equity prices; in 1996, he hinted, with the term “irrational exuberance,” that equity prices were too strong relative to earnings.  The blowback was severe enough that he never mentioned it again.  Federal Reserve policy on this topic is that market bubbles cannot be determined in real-time, and if one occurs, it is easier to address the damage afterward.[1]

Another example is Paul Volcker’s shift to money supply targeting from interest rate targeting.  Money supply targeting allowed the Fed to raise rates to unprecedented levels.  Targeting a 19.1% fed funds rate (for the record, in June 1981) would have been impossible politically.  But having that rate occur “naturally” by constraining the money supply led to the necessary outcome in a politically possible manner.

We may be seeing the Powell Fed attempting something similar.  Although the Philips Curve has been mostly disavowed by the Fed, in reality, the spirit of the relationship remains; to contain inflation, the Fed has to slow the economy down enough to create slack in the economy.  In simple terms, it means the Fed must create unemployment to bring inflation down.  Even under conditions of low unemployment, such a policy is politically unpalatable.

So, both Chair Powell and Governor Waller have suggested that instead of raising unemployment, it may be possible to reduce the “froth” in the labor markets by decreasing the number of job openings.  That idea is tied to a concept called the “Beveridge Curve.”

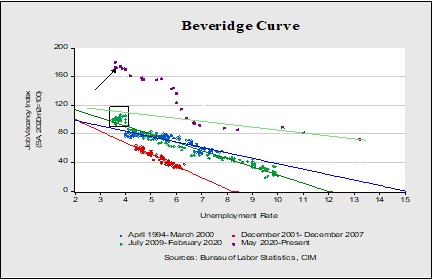
The Beveridge Curve looks at the relationship between job openings and unemployment.  This curve attempts to show the efficiency between job openings and filling those openings.  In general, moving away from the origin suggests less efficiency.  The slope of the curve is also important.  A flatter slope suggests greater efficiency because it takes relatively fewer job openings to lower unemployment.  We have created curves for the last four business cycles, starting in 1994.  After the 2001 recession, the efficiency of the labor market improved as the curve moved toward the origin.  Although, the slope did steepen.  In the expansion of 2009 through 2020, efficiency fell.  That was offset partially by a flatter slope.

The points in the box show the end of the last expansion.  Note how the slope essentially steepened.  As job openings rose, it became harder to fill them.  And then the pandemic hit.  The current curve has steepened dramatically; the most recent data point is shown with an arrow.  Essentially, the Powell/Waller position is that wage pressures could ease if openings fell back to the slope of the green line running from 2020 into early 2021.  In other words, we could see slack develop without a significant rise in the unemployment rate.  Waller argues that if hiring efficiency improves, we might be able to ease inflation pressures without a recession.

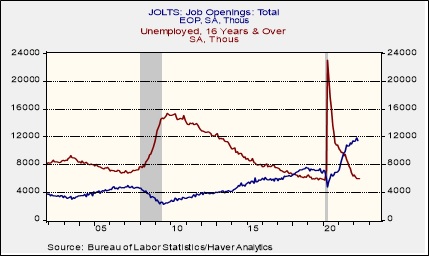
This chart is another way of looking at the data.  It measures the number of unemployed to the number of job openings.  Note that from 2018 to 2020, openings briefly exceeded the unemployed; at that time, the Beveridge curve slope started to steepen.  Pre-pandemic, the difference between the above chart and wage growth for non-supervisory workers does show a +70% positive correlation with the difference leading wage growth by about a year.  So, if job openings decline, over time, it should ease wage pressures.

However, the pandemic has upended the job market to some extent.  This event led to an increase in older workers leaving the workforce; so far, robust wages have not been enough to draw them back into the labor force.  It seems more likely that bringing down job openings will probably require some rise in unemployment.  But by focusing on job openings instead of increasing unemployment, the FOMC may buy some degree of political cover to weaken the labor market.

View PDF


[1] This is similar to Bob Uecker’s advice on how to catch a knuckleball…” wait until it stops rolling and pick it up.”

Daily Comment (April 6, 2018)

by Bill O’Grady and Thomas Wash

[Posted: 9:30 AM EDT] Happy employment day!  We cover the data in detail below but the quick take is that it was much weaker than expected.  Payrolls came in well below forecast and the unemployment rate held steady compared to an expected small decline.  The data should be taken with caution because the parade of winter storms that hit the Northeast last month probably affected the report.  The other major issue is, again, trade.  Here is what we are watching this morning:

Tit for tat: Last night, President Trump suggested another $100 bn of new tariffs on China because of its reaction to the first salvo.  The usual market response developed; equity futures slid while gold and Treasuries rallied.  However, the reaction was not as pronounced compared to earlier periods.  It appears the financial markets are steadily adjusting to the president’s social media messages and beginning to focus more on the endpoint than the tweet.  The situation with China remains fluid and there is still the probability of a trade war.  But, there is also the potential for the outcome we have seen with NAFTA as it seems the U.S., Canada and Mexico are nearing an agreement.  When the discussions began, it looked like the treaty was in deep trouble.  Now, it looks like all the rhetoric was a negotiating stance.

It is still important to remember that China has taken advantage of the U.S. and the West during its development.  This isn’t anything new.  Export promotion has become the development model of choice since the end of WWII.  The basic recipe is to implement policies that curtail consumption and boost investment.  These policies include an undervalued exchange rate, import restrictions, easy corporate borrowing and intellectual property theft.  The program works if the global superpower tolerates it.  The U.S. did tolerate this behavior during the Cold War, although there were occasional pushbacks (the Plaza Accord, “voluntary” Japanese vehicle import restrictions, etc.).  However, every nation that deploys the model reaches a point of development where it no longer works.  First, other nations begin to retaliate against the trade surpluses.  Second, debt levels usually become untenable.  There are essentially four paths to transition away from export promotion.  The first is to boost household consumption by reducing saving.  This approach can create a debt crisis; in the U.S., resolving this crisis was called “anyone, anyone, the great, Great, Depression.”[1]  In Japan, it has led to 30 years of stagnation.  The second path is war.  War allows the nation to redirect its excess capacity to the war effort instead of exports.  The winner destroys the export capacity of his enemy and can keep export promotion policies in place, perhaps even gaining colonies (see below).  The third path is to raise the value chain.  The excess capacity is transformed into higher value goods.  Germany has used this path since the 1980s and the China 2025 plan looks like a similar plan.  The fourth path is colonization, where colonies are forced to absorb the excess production caused by malinvestment.  The U.K. used this system with its commonwealths, Germany is using it now with the Eurozone and China hopes to use the same method with the “one belt, one road” program.  China knows it is at a critical point where it needs to transition its economy.  Chairman Xi has amassed enough power to give him the wherewithal to make these difficult changes.

To some extent, U.S. goals of reducing its trade deficit with China are consistent with China’s goals of restructuring its economy.  However, China won’t simply accept U.S. trade impediments as they are seen as a form of attack on its sovereignty.  Encouraging a stronger CNY and dictating global trade rules, as TTP would have done, would have been a better path.  Thus, we have the risk of a trade war, but such a conflict is still avoidable.

Oil tariffs?  There are growing fears that China will put tariffs or quotas on U.S. crude oil exports.  Tariffs might occur, but they would likely be ineffective.  U.S. oil exports to China are rising but are still only about 300 kpbd as of January.  Nevertheless, if China raises the cost of U.S. oil exports, other nations will fill the U.S. market share.  But, since oil is mostly fungible, the flows will change but U.S. exports should remain the same.  For example, let’s say Saudi Arabia fills the U.S. market share.  Unless the Saudis increase output and violate their OPEC quota, they will reduce oil sales to some other customer and the U.S. will likely fill that gap.  The same thing could happen with soybeans.  China needs commodities, and selectively slapping tariffs on U.S. commodity exports will have an effect on flows but not necessarily on overall exports.

View the complete PDF


[1] https://www.youtube.com/watch?v=uhiCFdWeQfA