Asset Allocation Weekly – The Inflation Adjustment for Social Security Benefits in 2022 (October 22, 2021)

by the Asset Allocation Committee | PDF

Even for dedicated, successful investors who have built up a substantial nest egg, Social Security retirement and disability investments can be an important part of one’s financial security.  For many Americans, Social Security benefits may be the only significant source of income in old age.  On average, Social Security benefits account for approximately 30% of elderly people’s income and more than 5% of all personal income in the U.S.  One aspect of Social Security is especially important in the current period of galloping price inflation: by law, Social Security benefits are adjusted annually to account for changes in the cost of living.  In this report, we discuss the Social Security cost-of-living adjustment (COLA) for 2022 and what it implies for the economy.

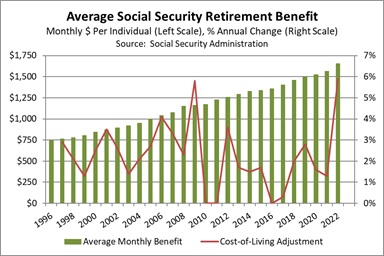
This week, the Social Security Administration announced that Social Security retirement and disability benefits will rise 5.9% in 2022, bringing the average retirement benefit to an estimated $1,657 per month (see chart below).  The increase, which will be the biggest since 1982, will boost the average recipient’s monthly benefit by about $92.  The benefit rise was right in line with expectations, given that it is computed using a special version of the Consumer Price Index (CPI) that is widely available.  The COLA process also affected some other aspects of Social Security, although not necessarily by the same 5.9% rate.  For example, the maximum amount of earnings subject to the Social Security tax was hiked to $147,000, up 2.9% from the maximum of $142,800 in 2021.

Media commentators often fret that the Social Security COLA could be “eaten up” by rising prices in the following year or that the benefit boost could provide a windfall if price increases slow down.  In truth, the COLA merely aims to compensate beneficiaries for price increases over the past year.  It’s designed to maintain the purchasing power of a recipient’s benefits given past price changes.  Price changes in the coming year will be reflected in next year’s COLA.

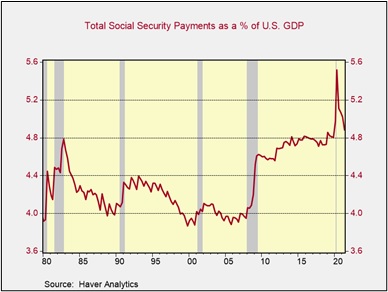
For the overall economy, the inflation-adjusted nature of Social Security benefits is particularly important.  Since so many members of the huge Baby Boom generation have now retired, and since more and more people are drawing disability benefits than in the past, Social Security income has become a larger part of the economy (see chart below).  In 2020, Social Security retirement and disability benefits accounted for fully 5.2% of the U.S. gross domestic product (GDP).  Having such a large part of the economy subject to automatic cost-of-living adjustments helps ensure that a big part of demand is insulated from the ravages of inflation, albeit with some lag.  In contrast, if Social Security income were fixed, a large part of the population would see their purchasing power drop sharply, which not only might reduce demand but could also spark political instability.

Finally, it’s important to remember that an individual’s own Social Security retirement benefit isn’t just determined by inflation.  The formula for computing an individual’s starting benefit is driven in part by wage and salary history.  Higher compensation will boost a retiree’s initial retirement benefit, which will then be adjusted via the COLA process over time.  As average worker productivity increases, average wages and salaries have tended to grow faster than inflation, and as a result, the average Social Security benefit has grown much faster than the CPI.  Over the last two decades, the average Social Security retirement benefit has grown at an average annual rate of 3.2%, while the CPI has risen at an average rate of just 2.2%.  In sum, Social Security benefits provide an important source of growing purchasing power that helps buoy demand and corporate profits in the economy.

View PDF

Weekly Energy Update (October 21, 2021)

by Bill O’Grady, Thomas Wash, and Patrick Fearon-Hernandez, CFA | PDF

[N.B. Today’s report was delayed one day due to the Columbus/Indigenous Day holiday.]

Prices have moved above $80 per barrel.

(Source: Barchart.com)

Crude oil inventories unexpectedly fell 0.4 mb compared to a 2.0 mb build forecast.  The SPR declined 1.7 mb, meaning the net draw was 2.1 mb.

In the details, U.S. crude oil production fell 0.1 mbpd to 11.3 mbpd, remaining below the 11.5 mbpd pre-Ida level.  Exports rose 0.5 mbpd, while imports declined 0.2 mbpd.  Refining activity fell 2.0%.  We are in refinery maintenance season, which accounts for the usual seasonal build in crude oil inventories seen in the chart below.  This week’s draw is contraseasonal.

(Sources: DOE, CIM)

This chart shows the seasonal pattern for crude oil inventories.  We are in the autumn build season.  Note that stocks are significantly below the usual seasonal trough.  Our seasonal deficit is 68.8 mb.

Based on our oil inventory/price model, fair value is $65.70; using the euro/price model, fair value is $58.26.  The combined model, a broader analysis of the oil price, generates a fair value of $61.67.  We are seeing a notable divergence in the model between inventory and the dollar and a rising level of overvaluation.  Part of the overvaluation is likely due to fears of tighter inventories. If the builds continue, which is consistent with seasonal patterns, the model suggests some moderation of prices.  However, supply fears are so elevated this may not be the case.

 Market news:

The relationship between oil production and prices varies over time, but in recent history, a $60 per barrel oil price generated 13.0 mbpd of production.  Nearly $80 now is only fostering production marginally over 11.0 mbpd.  To some extent, higher prices will speed the transition to alternative energy, but the pain it involves will not be popular.

  • In related news, Exxon (XOM, USD, 63.53) is considering whether it should continue with several oil and gas projects.  Earlier this year, the board added members of Engine No. 1, an environmental activist group.  It appears their presence may be affecting the company’s production, potentially reducing future oil and gas supplies.
  • As fossil fuel production is being restricted, it’s affecting electricity production globally.  From California to China, generators are struggling to acquire fuel for electricity production.  If shortages persist, it will further crimp industrial activity.
  • Although banks are pledging to cut funding for Arctic oil development, the promises apparently have some loopholes.  Still, the trend in place suggests that financing will remain difficult for fossil fuel companies.
  • Rising U.S. LNG exports are lifting flows at the Henry Hub in Louisiana.
  • The oil futures options markets are starting to see activity in the far out-of-the-money call options.

Geopolitical news:

  • As the U.S. reduces its activities in the Middle East, the KSA and Iran are trying to improve relations.  The two nations are long-time adversaries, but the KSA has relied on the U.S. to contain Iran.  As the U.S. focuses on containing China, Riyadh appears to have concluded that it will need to live with Iran and thus needs to foster a new relationship.
  • Although the U.S. continues to work toward Iran returning to the 2015 nuclear deal, there is no discernable progress on this issue.  However, we note that the JCPOA is popular with Iranians because it could relieve the current sanctions regime.  So, eventually, Tehran may decide to return to negotiations.
  • In recent Iraqi elections, Muqtada al-Sadr’s bloc won a plurality and is the most powerful party in the parliament.  Iran has mixed views about al-Sadr.  They appreciate his anti-U.S. stance, but he is also pro-Iraqi and may oppose Tehran’s efforts to control Iraq.
  • There had been tentative steps to improve relations with Venezuela, but the U.S. extradition of an ally of Venezuelan President Maduro has frozen talks.  Alex Saab, a Colombian businessman with ties to Caracaras, was arrested in the African state of Cape Verde in June 2020.  The country has agreed to extradite him to the U.S., where he will be arraigned on money laundering charges.
  • Russia has been using the current energy crisis in Europe to press for EU concessionsLong-term forecasts suggest Russia’s hold on the natural gas market will likely increase in the coming decades.

 Alternative energy/policy news:

  View PDF

Weekly Energy Update (October 15, 2021)

by Bill O’Grady, Thomas Wash, and Patrick Fearon-Hernandez, CFA | PDF

[N.B. Today’s report was delayed one day due to the Columbus/Indigenous Day holiday.]

Prices have moved above $80 per barrel.

(Source: Barchart.com)

Crude oil inventories rose 6.1 mb compared to the 1.1 build forecast.  The SPR declined 0.8 mb, meaning the net draw was 5.3 mb.

In the details, U.S. crude oil production rose 0.1 mbpd to 11.4 mbpd, approaching the 11.5 mbpd pre-Ida level.  Exports rose 0.4 mbpd, while imports declined 1.0 mbpd.  Refining activity fell 2.9%.

(Sources: DOE, CIM)

This chart shows the seasonal pattern for crude oil inventories.  We are in the autumn build season.  Note that stocks are significantly below the usual seasonal trough.  Our seasonal deficit is 68.4 mb.

Based on our oil inventory/price model, fair value is $65.55; using the euro/price model, fair value is $57.99.  The combined model, a broader analysis of the oil price, generates a fair value of $61.44.  We are seeing a notable divergence in the model between inventory and the dollar and a rising level of overvaluation.  Part of the overvaluation is likely due to fears of tighter inventories. If the builds continue, which is consistent with seasonal patterns, the model suggests some moderation of prices.  However, supply fears are so elevated this may not be the case.

In some respects, this week’s data doesn’t add up; the build with imports significantly down suggests that we may be seeing higher production than is being reported.  The plug number of “unaccounted for crude oil” is elevated, suggesting an undercount, and the most likely area is production, which is estimated.

The most recent official U.S. oil production data, which is through August, shows production at 11.1 mbpd.  We suspect production is probably closer to 11.6 mbpd.

 Market news:

Geopolitical news:

 Alternative energy/policy news:

  View PDF

Weekly Energy Update (October 7, 2021)

by Bill O’Grady, Thomas Wash, and Patrick Fearon-Hernandez, CFA | PDF

Prices are approaching $80 per barrel.

(Source: Barchart.com)

Crude oil inventories rose 2.3 mb compared to the 1.0 build forecast.  The SPR declined 0.9 mb, meaning the net draw was 1.4 mb.

In the details, U.S. crude oil production rose 0.2 mbpd to 11.3 mbpd, approaching the 11.5 mbpd pre-Ida level.  Exports fell 0.4 mbpd, while imports declined 0.9 mbpd.  Refining activity rose 0.3%.

(Sources: DOE, CIM)

This chart shows the seasonal pattern for crude oil inventories.  We are in the autumn consolidation and build season.  Note that stocks are significantly below the usual seasonal trough.  Our seasonal deficit is 72.3 mb.

Based on our oil inventory/price model, fair value is $67.48; using the euro/price model, fair value is $58.26.  The combined model, a broader analysis of the oil price, generates a fair value of $62.66.  We are seeing a notable divergence in the model between inventory and the dollar and a rising level of overvaluation.  Some of the overvaluation is likely due to fears of tighter inventories. If builds continue (and the seasonal pattern indicates a modest build that will start later in October), we will probably see some moderation of prices.

Ida

Thankfully, Hurricane Ida was not followed up by a subsequent storm as with Katrina in 2005.  Since the comparison is becoming less relevant, this will be the last week of reporting on this issue.

(Source:  DOE, CIM)

This chart compares refinery runs during the two periods following the hurricanes.  In 2005, Hurricane Rita soon followed Katrina.  Since that didn’t occur with Ida (at least so far), we have seen refinery activity return to normal this week.

 Market news:

Geopolitical news:

 Alternative energy/policy news:

  • As the U.K. energy crisis unfolds, PM Johnson is being pressed on his plans for decarbonization.  Part of Britain’s plans to address decarbonization is through subsidies and surcharges designed to encourage conservation and cleaner energy consumption.   Although politically unpopular, it will be practically impossible to decarbonize without raising prices on oil, gas, and coal.
  • Among the alternative energy sources, tapping tides has not received significant attention, but in coastal regions, it could be an important source of clean energy.  Tides are powerful and regular, and tapping them could be beneficial.
  • We have been reporting on new technologies in nuclear power.  We note a recent article in Mother Jones discussing nuclear pellet technology.  Although the reporting isn’t breaking new ground, the fact it is in left-wing media suggests a growing recognition that nuclear power will be part of decarbonization.
  • Exxon (XOM, USD, 60.10) is continuing efforts to create biofuels from algae.
  • Although reducing carbon emissions is important, the reality is that even if we were net carbon zero today, climate warming would likely continue for decades.  This fact has led to continued attempts to pull carbon from the atmosphere.  It is also likely, at some point, that geoengineering will be deployed to cool the planet.

  View PDF

Weekly Energy Update (September 30, 2021)

by Bill O’Grady, Thomas Wash, and Patrick Fearon-Hernandez, CFA | PDF

Prices have rallied to above $75 per barrel.

(Source: Barchart.com)

Crude oil inventories unexpectedly rose 4.6 mb compared to the 2.5 mb draw forecast.  The SPR declined 0.9 mb, meaning the net draw was 3.8 mb.

In the details, U.S. crude oil production rose 0.5 mbpd to 11.1 mbpd, still below the 11.5 mbpd pre-Ida but also clearly recovering.  Exports rose 0.2 mbpd, while imports increased 0.1 mbpd.  Refining activity rose 0.6% as hurricane recovery continues.

(Sources: DOE, CIM)

This chart shows the seasonal pattern for crude oil inventories.  We are in the autumn consolidation and build season.  Note that stocks are significantly below the usual seasonal trough.  Our seasonal deficit is 73.8 mb.  We suspect the disruptions from Hurricane Ida (see below for updates) have affected this data, but the impact is starting to fade.

Based on our oil inventory/price model, fair value is $68.13; using the euro/price model, fair value is $62.10.  The combined model, a broader analysis of the oil price, generates a fair value of $65.07.  Continued dollar strength is weighing on oil prices.  The decline in inventory, on the other hand, is a bullish factor.

Ida

Hurricane Ida followed a path similar to Hurricane Katrina.  For the next few weeks, we will track the impact of Ida on the oil and gas market, using Katrina as a baseline comparison.

(Source:  DOE, CIM)

This chart compares refinery runs during the two periods following the hurricanes.  This week, refinery operations recovered modestly.  In 2005, Katrina was soon followed by Hurricane Rita.  Barring a repeat, we would assume refineries will continue to rise to around 90% of capacity, and then stabilize.

 Market news:

  • Both Europe and Asia are facing an energy crisis.
    • In the U.K., the supply chain for energy is showing signs of deep disruption.  Gasoline lines and service station closures due to lack of supply have caused severe problems.  Part of the issue is panic buying by drivers.  Complicating the situation is a lack of truck drivers, a consequence of Brexit.  In leaving the EU, European drivers felt unwelcomed and returned home, leading to a lack of shipping capacity.
    • In Europe, tight supplies for natural gas are causing a supply crunch for electricity, sending prices soaring.  Europe is producing less natural gas, partly because of environmental regulations.  Russia has curtailed shipments, likely to “encourage” Germany to rush the approval of Nord Stream 2.  Although LNG could help ease this supply shortage, Asia, so far, has been outbidding the EU.
    • The EU’s environmental rules have also played a role.  Carbon prices, part of the EU’s cap-and-trade system, are rising, leading to higher gas prices as well.  Paradoxically, the shortage of natural gas is leading to supply problems for industrial carbon dioxide.  Natural gas is a feedstock for fertilizer, and making that product creates CO2 as a byproduct.  High natural gas prices have curtailed fertilizer manufacturing (something to watch for farmers in the coming months) and consequently CO2.
  • While the EU is struggling with natural gas and oil product supplies, China is forcing electric generators to curtail output to address severe pollution problems.  These regulations, coupled with rising natural gas and coal prices, are making utilities reduce the electricity supply, leading to falling industrial output.  These actions will exacerbate current global supply chain problems and will reduce China’s economic growth.
    • China has made regulatory reductions before.  There was a falloff in industrial output before the 2008 Summer Olympics.

Of course, the total decline in industrial production cannot be attributed to the games (a global recession was also part of that); the earlier ones were temporary.  The current reductions appear to be longer-lasting, perhaps leading to less global productive capacity.

Geopolitical news:

 Alternative energy/policy news:

  • Given the energy crisis in the U.K., policymakers are considering increasing their commitment to nuclear power.
  • Ford (F, USD, 14.36) announced a major effort to expand electric car and light truck production.  As we noted last week, Ford plans to recycle exhausted batteries, turning their cars into a closed loop.  This week, the company not only announced new vehicle production facilities but also announced a strong move into battery production.

  View PDF

Weekly Energy Update (September 23, 2021)

by Bill O’Grady, Thomas Wash, and Patrick Fearon-Hernandez, CFA | PDF

Prices continue to hold above $70 per barrel.

(Source: Barchart.com)

Crude oil inventories fell 3.5 mb compared to the 2.8 mb draw forecast.  The SPR declined 1.2 mb, meaning the net draw was 4.7 mb.

In the details, U.S. crude oil production rose 0.5 mbpd to 10.6 mbpd, still below the 11.5 mbpd pre-Ida but also clearly recovering.  Exports rose 0.2 mbpd, while imports increased 0.7 mbpd.  Refining activity rose 5.4% as hurricane recovery continues.

(Sources: DOE, CIM)

This chart shows the seasonal pattern for crude oil inventories.  We are in the autumn consolidation and build season.  Note that stocks are significantly below the usual seasonal trough.  Our seasonal deficit is 78.1 mb.  We expect the disruptions from Hurricane Ida (see below for updates) will affect this data in the coming weeks.

Based on our oil inventory/price model, fair value is $69.58; using the euro/price model, fair value is $62.83.  The combined model, a broader analysis of the oil price, generates a fair value of $66.27.  Continued dollar strength is weighing on oil prices.  The decline in inventory, on the other hand, is a bullish factor.

Ida

Hurricane Ida followed a path similar to Hurricane Katrina.  For the next few weeks, we will track the impact of Ida on the oil and gas market, using Katrina as a baseline comparison.

(Source:  DOE, CIM)

This chart compares refinery runs during the two periods following the hurricanes.  This week, refinery operations recovered strongly.  In 2005, Katrina was soon followed by Hurricane Rita.  Barring a repeat, we would assume refineries will continue to come back online.

 Market news:

  • The European natural gas crisis has intensified as supplies continue to tighten.  Inventories are at decade lows.

Three more U.K. natural gas suppliers to consumers have failed this week, stranding 1.5 million homeowners without natural gas service.  The firms apparently provided price caps without adequate price hedges, and as natural gas prices have soared, the firms were losing money on each BCF they provided.  The firms are asking for government help, perhaps even creating a “bad bank” for customers with contracts that can’t be fulfilled.   Meanwhile, other EU governments are considering emergency aid to households faced with soaring power bills.

Geopolitical news:

 Alternative energy/policy news:

  • As EV’s become more common, there are worries about batteries, specifically, what to do with them when a car’s useful life is spent.  Ford (F, USD, 13.24) is working on a plat to recycle batteries used in its cars, creating a “closed-loop” solution.
  • A bill in Congress, supported by progressive Democrats, appears to require the Fed to act against financial institutions that lend to fossil fuel firms.  Although we doubt it will pass, the fact it was considered shows the hostile regulatory environment energy companies face.
  • The default of sovereign debt is a constant problem in international lending.  A couple of centuries ago, lenders might use the military to force borrowers to pay or collect collateral.  Those tactics are no longer deployed, but the problem hasn’t gone away.  Belize is working on a novel plan to buy back its heavily discounted debt with funds provided by The Nature Conservancy.  It will use the restructuring to pay for marine conservation projects on its coral reefs.  If this works, one could see how other nations might try to do something similar.

 View PDF

Weekly Energy Update (September 16, 2021)

by Bill O’Grady, Thomas Wash, and Patrick Fearon-Hernandez, CFA | PDF

Prices moved above $70 per barrel.

(Source: Barchart.com)

Crude oil inventories fell 6.4 mb compared to the 3.6 mb draw forecast.  The SPR declined 0.5 mb, meaning the net draw was 6.9 mb.

In the details, U.S. crude oil production rose 0.1 mbpd to 10.1 mbpd, well below the 11.5 mbpd pre-Ida.  Exports rose 0.3 mbpd, while imports declined 0.3 mbpd.  Refining activity rose 0.2%.

(Sources: DOE, CIM)

This chart shows the seasonal pattern for crude oil inventories.  We are in the autumn consolidation and build season.  Note that stocks are significantly below the usual seasonal trough.  Our seasonal deficit is 75.8 mb.  We expect the disruptions from Hurricane Ida (see below for updates) will affect this data in the coming weeks.

Based on our oil inventory/price model, fair value is $68.46; using the euro/price model, fair value is $63.39.  The combined model, a broader analysis of the oil price, generates a fair value of $65.96.  Continued dollar strength is weighing on oil prices.  The decline in inventory, on the other hand, is a bullish factor.

Ida

Hurricane Ida followed a path similar to Hurricane Katrina.  For the next few weeks, we will track the impact of Ida on the oil and gas market, using Katrina as a baseline comparison.  Firms continue to struggle to resume production after the event.

(Source:  DOE, CIM)

This chart compares refinery runs during the two periods following the hurricanes.  Refineries require electricity to operate, and damage to the electrical grid slows the recovery from the storm.  With Katrina, runs stabilized over the following few weeks, only to fall further by the end of the month.  We see a similar pattern with Ida.  We doubt we will see a similar plunge this year.  In the year Katrina hit the Gulf, it was followed a few weeks later by Hurricane Rita.  Therefore, if another storm hits the area, this chart gives us an idea of what might transpire.

Natural gas update:  We are seeing clear warnings that natural gas prices could be elevated this winter.  Europe is already facing a squeeze on supply and record prices.  By winter, it could be a crisisGlobal storage levels are tight, and with the advent of LNG, it means the U.S. supply situation is tightening as well.  The U.S. is warning that this situation will increase Europe’s reliance on Russian gas, which will give Moscow leverage over the EU.

Supply has been falling for the past several months.  Even though consumption is also falling, it is declining more slowly, leading to a negative balance.  That is bullish for prices.  The supply problem seems to be tied to two issues.  Net imports are sharply negative (or, put another way, the U.S. is now a net exporter), and production has stalled.  On a yearly basis, production peaked in April 2020 and has fallen 3.6% since then.  The most likely reason is the lack of investment in new output.

The chart on the left shows supply (production + net imports) and consumption on a rolling 12-month basis.  The lower line shows the balance.  Although we don’t expect these imbalances to lead to the explosive rise in prices seen in the first decade of the century, $6.00 per MMBTU isn’t out of the question.

The imbalance has led to tightening inventory levels.  It appears increasingly likely we will enter the winter with less-than-normal stockpiles.

 Market news:

Geopolitical news:

 Alternative energy/policy news:

 View PDF

Weekly Energy Update (September 10, 2021)

by Bill O’Grady, Thomas Wash, and Patrick Fearon-Hernandez, CFA | PDF

Prices continued to consolidate in the high $60s.

(Source: Barchart.com)

Crude oil inventories fell 1.5 mb compared to the 6.0 mb draw forecast.  Analysts (including us) were clearly expecting Ida to bring a large draw.  However, the drop in exports and the slide in refinery operations prevented a significant decline.  The SPR was unchanged this week.

In the details, U.S. crude oil production fell 1.5 mbpd to 10.0 mbpd.  Exports fell 0.7 mbpd, while imports declined 0.5 mbpd.  Refining activity fell 9.4%, led by a 16.7% slide in the Gulf region.

(Sources: DOE, CIM)

This chart shows the seasonal pattern for crude oil inventories.  We are at the end of the summer withdrawal season.  Note that stocks are significantly below the usual seasonal trough.  A normal seasonal decline would result in inventories around 550 mb.  Our seasonal deficit is 69.7 mb.  We expect the disruptions from Hurricane Ida (see below for updates) will affect this data in the coming weeks.

Based on our oil inventory/price model, fair value is $66.42; using the euro/price model, fair value is $63.76.  The combined model, a broader analysis of the oil price, generates a fair value of $65.05.  Continued dollar strength is weighing on oil prices; the decline in inventory, on the other hand, is a bullish factor.

Ida

Hurricane Ida followed a path similar to Hurricane Katrina.  For the next few weeks, we will track the impact of Ida on the oil and gas market, using Katrina as a baseline comparison.  This week, we will look at refinery operations.

(Source:  DOE, CIM)

This chart compares refinery runs during the two periods.  Refineries require electricity to operate, and damage to the electrical grid will slow the recovery from the storm.  With Katrina, runs stabilized over the following few weeks, only to fall further by the month’s end.  We doubt we will see a similar plunge this year, as outside the Gulf region, most refinery activity was already depressed.

 Market news:

  • Natural gas prices have been on a tear this year.

(Source: Barchart.com)

Although these increases pale in comparison to the first decade of the century, they are in a range of highs seen in the shale era.  With the expansion of LNG, natural gas has become a more global commodityWe note supplies are tight in Europe, making the region vulnerable to a cold winter.  It will also support U.S. prices as producers struggle to meet global demand.

  • China tapped its SPR for the first time in response to higher oil prices.  The news did send prices lower initially.  Although Beijing could justify the release because of Hurricane Ida, the National Food and Strategic Reserves Administration indicated the release was due to rising raw materials prices.  In general, the U.S. rarely uses the SPR to control prices.  It is usually tapped as a result of a weather-related supply event or for budgetary reasons.  It is possible that China may operate its SPR as a buffer stock, buying when prices are low and selling when they are high.  If they act in this manner, it will take some pressure off of OPEC+ to maintain prices.
  • As the budget process begins, groups facing higher taxes, namely, the oil and gas industry, are pushing back.  Of particular interest is a fee on methane leakages.  Methane is a powerful greenhouse gas, and it often leaks into the atmosphere during oil and gas drilling.  There is proposed legislation for new fees on methane leaks.  The oil industry is pushing back against this proposal, as expected.  As fees on carbon become more common, the likelihood increases that oil, gas, and coal resources become stranded.

Geopolitical news:

 Alternative energy/policy news:

View PDF

Weekly Energy Update (September 2, 2021)

by Bill O’Grady, Thomas Wash, and Patrick Fearon-Hernandez, CFA | PDF

After reaching $62 per barrel support, prices have snapped back and are consolidating around $68 per barrel.

(Source: Barchart.com)

Crude oil inventories fell 7.2 mb compared to the 2.5 mb draw forecast.  The SPR was unchanged this week.

In the details, U.S. crude oil production rose 0.1 mbpd to 11.5 mbpd.  Exports rose 0.2 mbpd, while imports were unchanged.  Refining activity fell 1.1%.

(Sources: DOE, CIM)

This chart shows the seasonal pattern for crude oil inventories.  We are at the end of the summer withdrawal season.  Note that stocks are significantly below the usual seasonal trough.  A normal seasonal decline would result in inventories around 550 mb.  Our seasonal deficit is 72.3 mb.  We expect the disruptions from Hurricane Ida (see below for updates) will affect this data in the coming weeks.

Based on our oil inventory/price model, fair value is $65.91; using the euro/price model, fair value is $61.96.  The combined model, a broader analysis of the oil price, generates a fair value of $63.78.  Continued dollar strength is weighing on oil prices; the decline in inventory, on the other hand, is a bullish factor.

Ida

Hurricane Ida followed a path similar to Hurricane Katrina.  Power outages have been widespread, and the oil and gas industry is still trying to determine the level of damage.  For the next few weeks, we will be tracking the impact of Ida on the oil and gas market, using Katrina as a baseline comparison.

(Source:  DOE, CIM)

This chart indexes the level of inventory for the week after the two hurricanes struck.  Since they hit at the same time of year 16 years apart, we can easily track the impact.  Katrina led to a 5% decline in stockpiles, and inventory wasn’t replenished until late October.

 Market news:

Geopolitical news:

  • Although Afghanistan is not a major oil producer, the withdrawal of U.S. and NATO troops will destabilize the region and might affect other oil producers nearby.  At the same time, Iran, which is under sanction, now has a customer for its oil that isn’t sanction’s sensitive.
  • Last weekend, at a regional summit held in Iraq, senior officials from the KSA and Iran attended the meeting.  They met directly for the first time in five years, at least officially.

 Alternative energy/policy news:

View PDF