

Weekly Energy Update (September 16, 2021)
by Bill O’Grady, Thomas Wash, and Patrick Fearon-Hernandez, CFA | PDF
Prices moved above $70 per barrel.
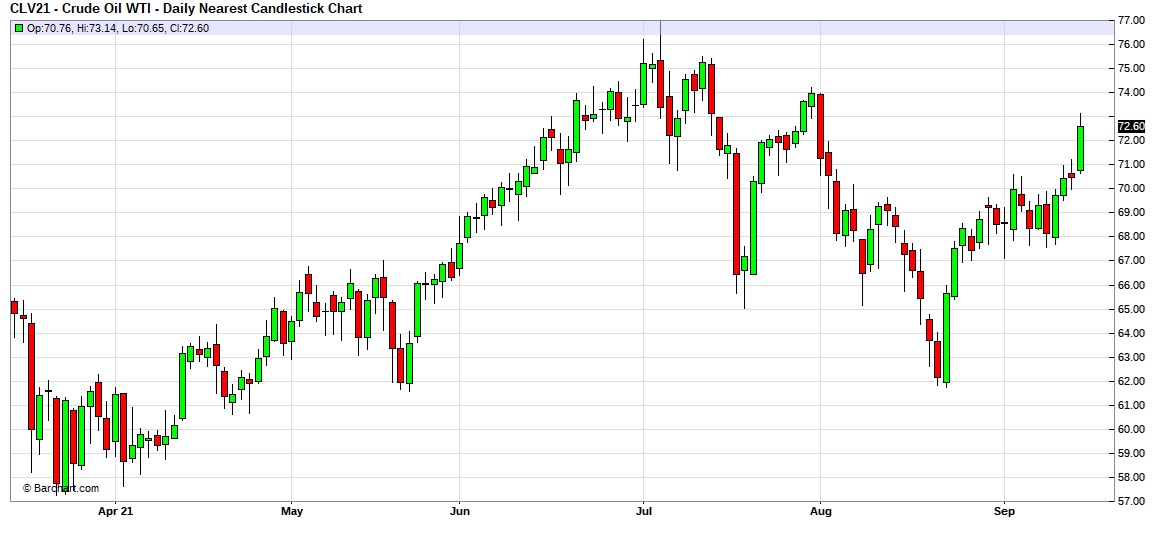
(Source: Barchart.com)
Crude oil inventories fell 6.4 mb compared to the 3.6 mb draw forecast. The SPR declined 0.5 mb, meaning the net draw was 6.9 mb.
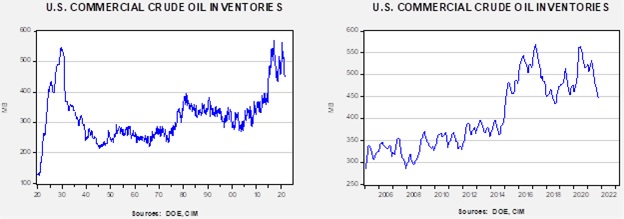
In the details, U.S. crude oil production rose 0.1 mbpd to 10.1 mbpd, well below the 11.5 mbpd pre-Ida. Exports rose 0.3 mbpd, while imports declined 0.3 mbpd. Refining activity rose 0.2%.
(Sources: DOE, CIM)
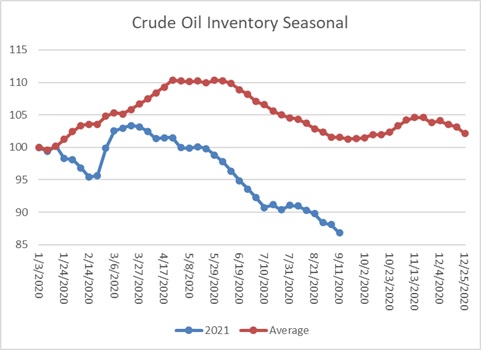
This chart shows the seasonal pattern for crude oil inventories. We are in the autumn consolidation and build season. Note that stocks are significantly below the usual seasonal trough. Our seasonal deficit is 75.8 mb. We expect the disruptions from Hurricane Ida (see below for updates) will affect this data in the coming weeks.
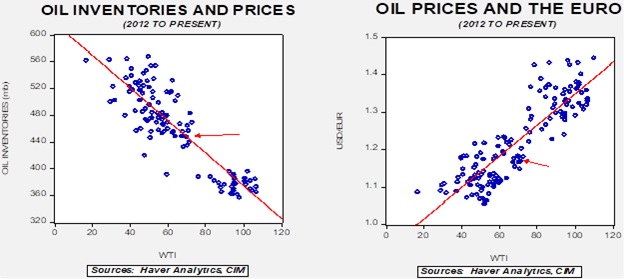
Based on our oil inventory/price model, fair value is $68.46; using the euro/price model, fair value is $63.39. The combined model, a broader analysis of the oil price, generates a fair value of $65.96. Continued dollar strength is weighing on oil prices. The decline in inventory, on the other hand, is a bullish factor.
Ida
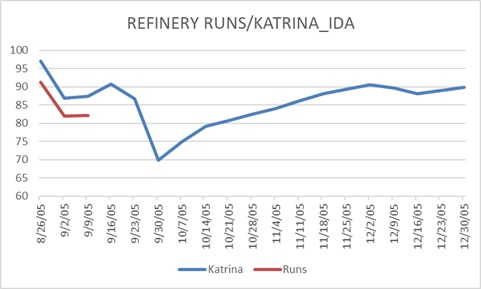
Hurricane Ida followed a path similar to Hurricane Katrina. For the next few weeks, we will track the impact of Ida on the oil and gas market, using Katrina as a baseline comparison. Firms continue to struggle to resume production after the event.
(Source: DOE, CIM)
This chart compares refinery runs during the two periods following the hurricanes. Refineries require electricity to operate, and damage to the electrical grid slows the recovery from the storm. With Katrina, runs stabilized over the following few weeks, only to fall further by the end of the month. We see a similar pattern with Ida. We doubt we will see a similar plunge this year. In the year Katrina hit the Gulf, it was followed a few weeks later by Hurricane Rita. Therefore, if another storm hits the area, this chart gives us an idea of what might transpire.
Natural gas update: We are seeing clear warnings that natural gas prices could be elevated this winter. Europe is already facing a squeeze on supply and record prices. By winter, it could be a crisis. Global storage levels are tight, and with the advent of LNG, it means the U.S. supply situation is tightening as well. The U.S. is warning that this situation will increase Europe’s reliance on Russian gas, which will give Moscow leverage over the EU.
Supply has been falling for the past several months. Even though consumption is also falling, it is declining more slowly, leading to a negative balance. That is bullish for prices. The supply problem seems to be tied to two issues. Net imports are sharply negative (or, put another way, the U.S. is now a net exporter), and production has stalled. On a yearly basis, production peaked in April 2020 and has fallen 3.6% since then. The most likely reason is the lack of investment in new output.
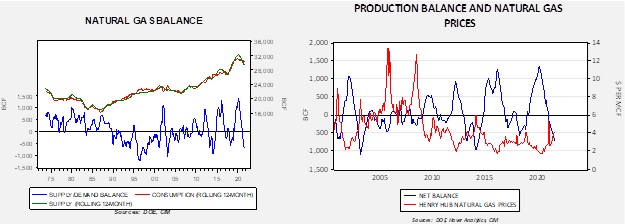
The chart on the left shows supply (production + net imports) and consumption on a rolling 12-month basis. The lower line shows the balance. Although we don’t expect these imbalances to lead to the explosive rise in prices seen in the first decade of the century, $6.00 per MMBTU isn’t out of the question.
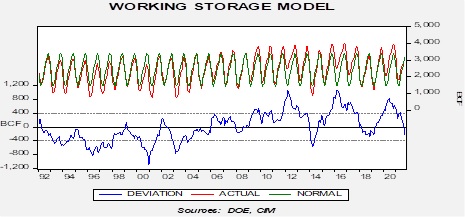
The imbalance has led to tightening inventory levels. It appears increasingly likely we will enter the winter with less-than-normal stockpiles.
Market news:
- As we reported last week, China executed a sale of oil from its strategic reserves. So far, the sale hasn’t turned the bullish tide in oil prices.
- The U.S. continues to build out the infrastructure for oil exports.
- Spain is seeing a massive rise in electricity prices due to a combination of rising natural gas prices and higher emission rights. The country has tacked on a windfall profits tax on utilities.
- OPEC+ is projecting a rapid rise in oil demand into Q4, primarily due to stronger Asian economic growth. Global demand is forecast to rise as well because of the recovery from the pandemic.
- Meanwhile, the IEA is warning that storm-related outages will reduce supply.
- Disinvestment by colleges and universities out of fossil fuels continues.
- Emerging market economies are asking for easier restrictions on fossil fuel investment to avoid crimping their development.
Geopolitical news:
- The IAEA and Iran have reached an agreement on nuclear monitoring, saving the talks to revive the 2015 nuclear deal. There are hopes that talks will resume soon. We have doubts that Iran and the U.S. can return to the former agreement. Tehran has accumulated enough enriched uranium to build a device in a month, although there is no indication it has mastered the technology to construct a deliverable weapon.
- Elections in Norway led to a center-left winner. This political arrangement is less supportive of oil production than the center-right, but it looks like the Greens won’t be a major coalition partner if the party enters the government at all. Thus, we expect Norwegian oil production to continue.
- The Nord Stream 2 pipeline is mostly complete. Testing and permitting remain the only significant hurdles. Senate Republicans are blocking White House nominations in protest to the administration, allowing the pipeline to progress unimpeded.
- Iranian and KSA talks are continuing.
Alternative energy/policy news:
- One element of the budget moving through Congress is new rules for utilities regarding the use of renewable energy. Utilities are trying to delay implementation to give themselves time to adjust.
- As governments consider carbon adjustment taxes on imports, the OECD is trying to create global guidelines to avoid these taxes used as trade impediments.
- Russia is trying to sell natural gas to China via pipelines. Beijing has been rather cool to the proposal. One factor is competition from LNG. The other is that wind and solar power from Mongolia are an alternative to Russian gas. It should be noted that despite this competition, Russia is reporting record sales of natural gas to China…which is gas not going to Europe.
- Chevron (CVX, USD, 97.77) plans to triple its investment in low carbon energy sources. Carbon capture is part of this mix.
- Wind and solar power prices have declined to a point where they are stiff competition to natural gas and coal. However, those renewable sources are intermittent; electricity prices in Europe spiked recently because the wind died down.
- Batteries are one answer to this problem. Although lithium and lead can be used in batteries, anything that can store energy can work as one. Thus, pumped water storage can “store” excess electricity. Energy Vault, a company that plans to use a pulley and cement block system to store energy, plans to go public via a SPAC.
- Another possibility for storing energy is hot silica.
- Higher prices for carbon emissions permits are putting pressure on Poland’s coal and gas plants.
- Thorium reactors for electricity have been an alternative to uranium nuclear facilities but have never caught on. Uranium plants yield material that can be used for nuclear weapons, making them attractive. Thorium would not, at least not directly. China is moving to a prototype thorium reactor, and if it can master the technology, it will likely move to expand its use.
- The move away from fossil fuels is about going from drilling to mining. Nickel is one area of focus.