

Weekly Energy Update (October 15, 2021)
by Bill O’Grady, Thomas Wash, and Patrick Fearon-Hernandez, CFA | PDF
[N.B. Today’s report was delayed one day due to the Columbus/Indigenous Day holiday.]
Prices have moved above $80 per barrel.
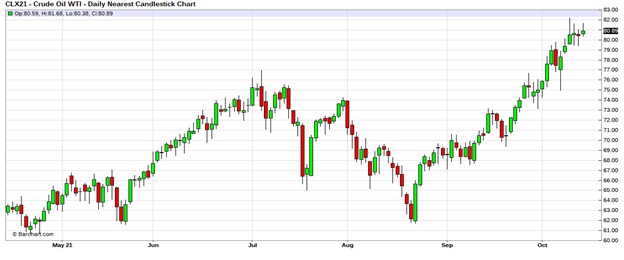
(Source: Barchart.com)
Crude oil inventories rose 6.1 mb compared to the 1.1 build forecast. The SPR declined 0.8 mb, meaning the net draw was 5.3 mb.
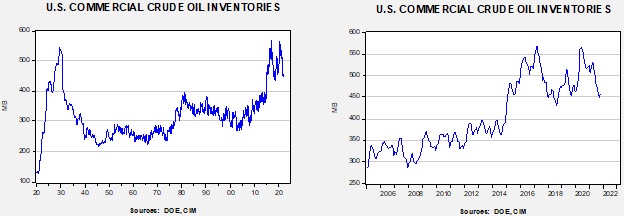
In the details, U.S. crude oil production rose 0.1 mbpd to 11.4 mbpd, approaching the 11.5 mbpd pre-Ida level. Exports rose 0.4 mbpd, while imports declined 1.0 mbpd. Refining activity fell 2.9%.
(Sources: DOE, CIM)
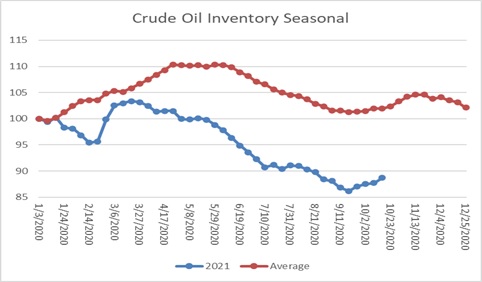
This chart shows the seasonal pattern for crude oil inventories. We are in the autumn build season. Note that stocks are significantly below the usual seasonal trough. Our seasonal deficit is 68.4 mb.
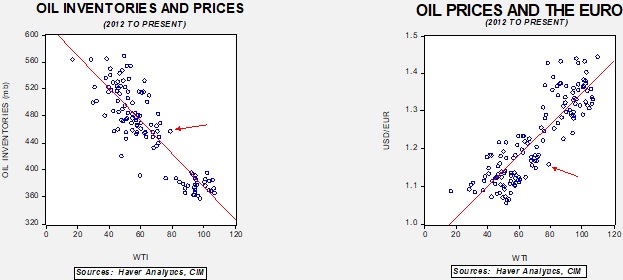
Based on our oil inventory/price model, fair value is $65.55; using the euro/price model, fair value is $57.99. The combined model, a broader analysis of the oil price, generates a fair value of $61.44. We are seeing a notable divergence in the model between inventory and the dollar and a rising level of overvaluation. Part of the overvaluation is likely due to fears of tighter inventories. If the builds continue, which is consistent with seasonal patterns, the model suggests some moderation of prices. However, supply fears are so elevated this may not be the case.
In some respects, this week’s data doesn’t add up; the build with imports significantly down suggests that we may be seeing higher production than is being reported. The plug number of “unaccounted for crude oil” is elevated, suggesting an undercount, and the most likely area is production, which is estimated.
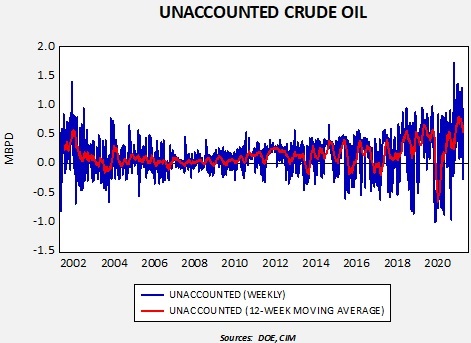
The most recent official U.S. oil production data, which is through August, shows production at 11.1 mbpd. We suspect production is probably closer to 11.6 mbpd.
Market news:
- The IEA released its World Energy Outlook annual report this week. The report makes it quite clear that the world is in an energy transition away from fossil fuels, but moving away from them will be rocky. The report notes that if nations hold true to their climate pledges, fossil fuel demand will peak in 2025. Such predictions create their own problems; after all, why would the industry make investments in future production if demand is expected to decline?
- Meanwhile, until a greener future materializes, rising demand and the lack of a robust supply response are leading to elevated prices. Oil drillers are struggling to deal with higher costs, and financing is becoming more difficult to acquire. As traditional sources of financing are lost, hedge funds are becoming a source of funding. This funding is usually more costly and often requires equity participation. At the same time, large banks haven’t completely abandoned the oil and gas industry, but the pressure is mounting to do so.
- Although it doesn’t appear the Biden administration will use the SPR at this time to reduce oil prices, it is being considered as an option. The White House invited U.S. oil companies for a visit to discuss how to bring oil prices down. This approach does work at cross purposes for its climate policy goals.
- The rise in energy prices is raising concern about its broader inflation effects. The DOE is warning U.S. consumers that winter heating prices could rise 30%.
- Europe is facing a crisis in natural gas supplies. The EU is trying to cushion the blow to consumers, but doing so reduces the price signaling effect, which is necessary to reduce demand. As gas prices remain elevated, some dual-fired plants are switching to fuel oil, something we rarely see.
- U.S. LNG exporters are taking steps to boost supply capacity to try to address the EU’s gas shortage.
- Even though coal prices have languished for years, elevated prices for oil and natural gas have made coal prices competitive. In China, reduced mine output and import issues tied to China’s trade policy toward Australia have led to supply shortages, soaring energy prices, and some outages, adversely affecting factory production. As China boosts imports of coal, oil, and natural gas, it is driving up prices worldwide, not just for energy but for a broad range of goods.
Geopolitical news:
- The energy crisis in the EU is giving Russia greater influence over Europe (and much of the rest of the world for that matter). We have doubts Russia can aggressively expand natural gas output to single-handedly solve Europe’s energy problems, but President Putin is promising to “help.” We suspect his goal is to force the EU into long-term supply contracts at lower prices than currently observed in the market but lock Europe into Russia’s supply network.
- The Biden administration wanted to return to the JCPOA, the Obama-era nuclear deal with Iran. Despite diplomatic efforts, Iran remains wary. In addition, there has been a change in government in Tehran to one that is much more hard-line compared to the last administration. There are growing worries that Iran will end up losing the opportunity to make a deal with the U.S. and have a chance to ease sanctions.
- Iran is trying to take advantage of Europe’s energy crisis to improve its diplomatic standing.
- The CIA has closed its Iran Mission Center, dedicated to gathering intelligence on Iran. Although this action might be taken as a positive move by the U.S. to relieve tensions, Tehran isn’t viewing it with favor, perhaps highlighting the level of distrust in the U.S.
- Tensions between Iran and Azerbaijan continue to escalate. Earlier, we noted Azerbaijan had arrested Iranian truck drivers who were delivering goods to Armenia. Iran has responded with military exercises on the Azerbaijan/Iranian frontier.
- Iraq held parliamentary votes this week; turnout was low and Shiite cleric Moqtada al-Sadr narrowly won the election. The low turnout tends to undermine the mandate from the election.
- Off the coast of Yemen is a decaying oil tanker that is in waters controlled by Houthi rebels. The tanker is not being maintained, and there are growing fears it will fail, triggering an oil spill that would be worse than the Exxon-Valdez.
- Iran and Saudi Arabia are in talks to restore ties and end the war in Yemen.
Alternative energy/policy news:
- As the world looks to develop cleaner fuels, hydrogen is an alternative. Currently, most hydrogen comes from natural gas, but it is possible to pull hydrogen from water using clean electricity.
- Natural gas is generally less polluting than other fossil fuels, but drilling, transporting, and storing this gas opens up the possibility for leakages and emitting damaging methane. We are beginning to see a greater focus on containing methane emissions. Reducing these emissions is expected to be a major policy goal from the upcoming COP26 conference.
- The process of carbon offsets, which entail funding methods that absorb CO2, is gaining momentum.
- Indigenous peoples’ activists are becoming another pressure group opposing oil and gas activities.
- Although nuclear power remains controversial, it will likely be necessary if the world wants to reduce carbon emissions. We are seeing uranium prices at nine-year highs on expectations that nuclear power will need to expand in the future. Thorium also remains an interesting alternative.
- Electric vehicles are gaining traction as a way to address carbon emissions. However, there are growing worries that the electric grid isn’t reliable enough to be a secure source of transportation energy.
- China is expanding its investment in Argentina’s lithium resources. Due to the risky investment climate, Argentina has lagged behind other producers, but China is apparently prepared to take the required risks.