by Bill O’Grady, Thomas Wash, and Patrick Fearon-Hernandez, CFA | PDF
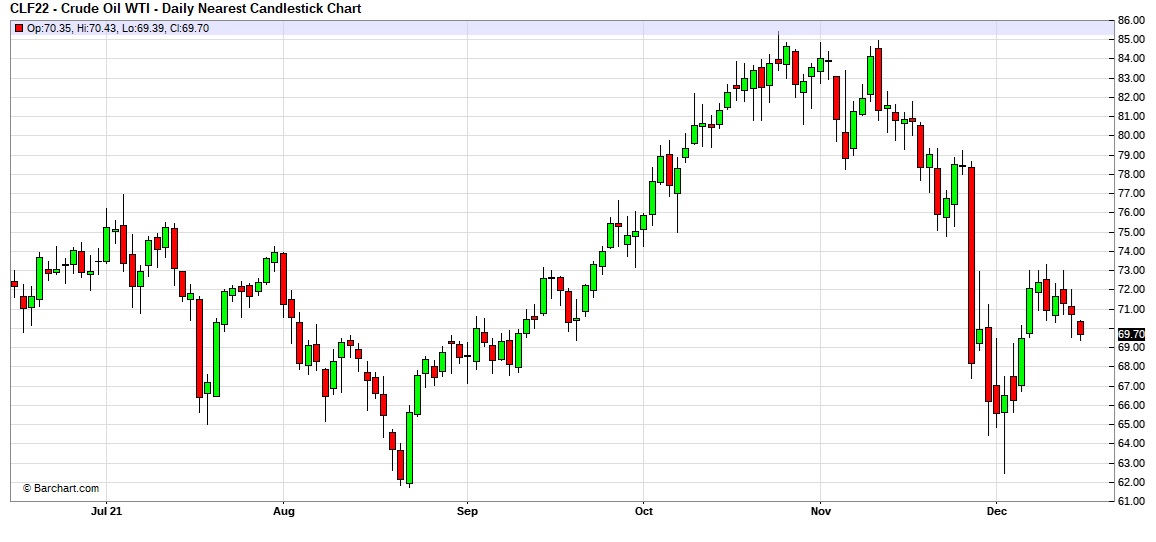
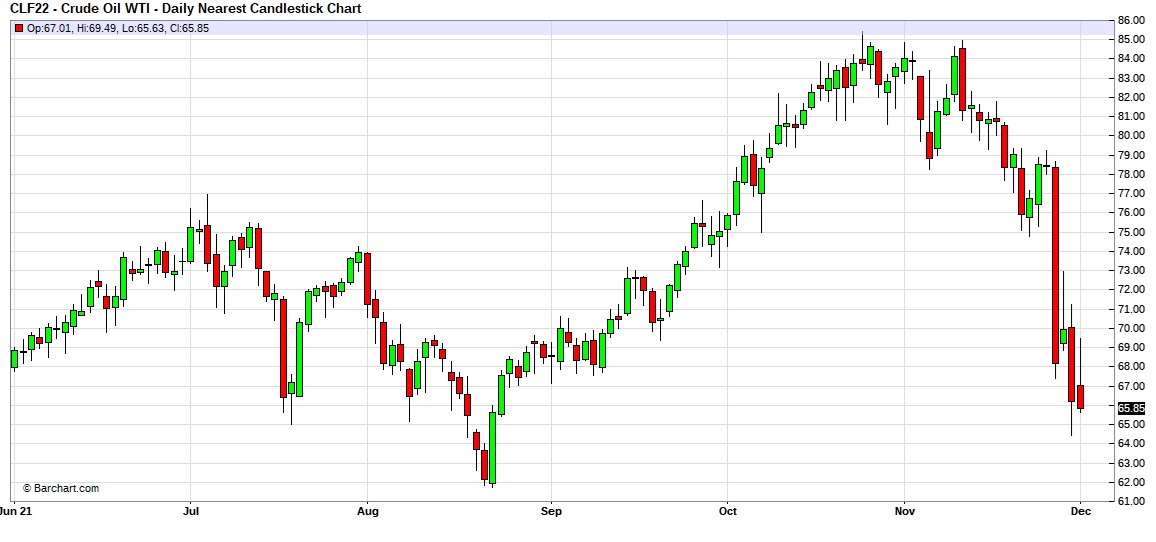
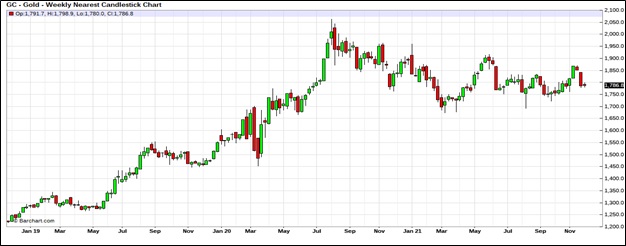
Since troughing in early December, oil prices have been steadily rising due to tightening supplies.
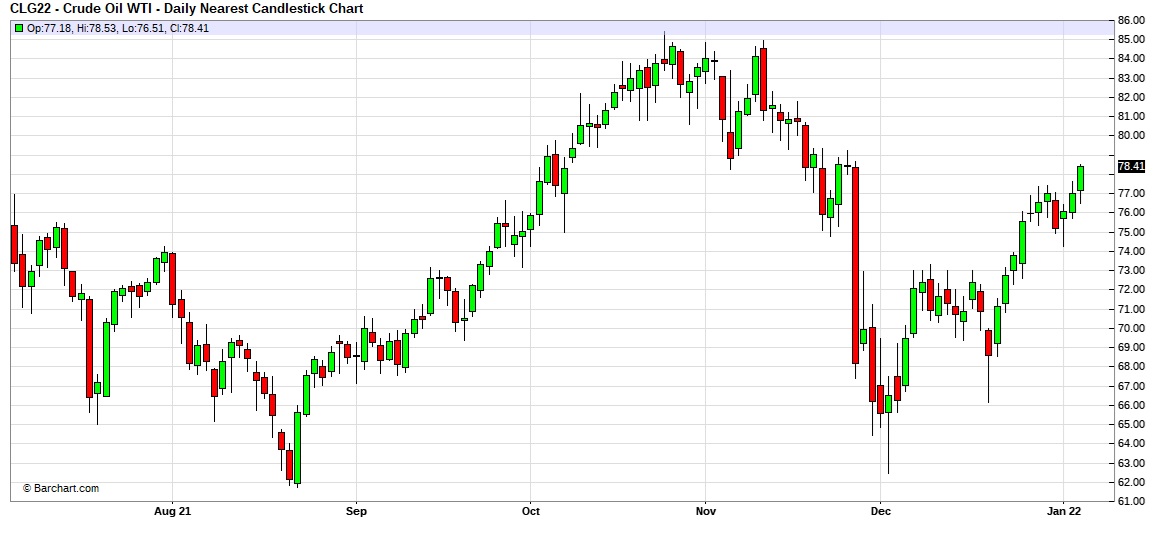 (Source: Barchart.com)
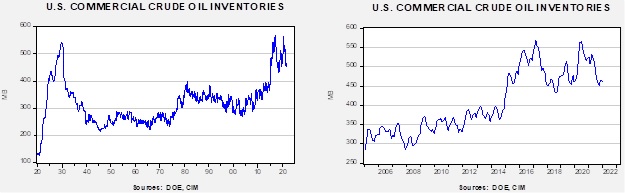
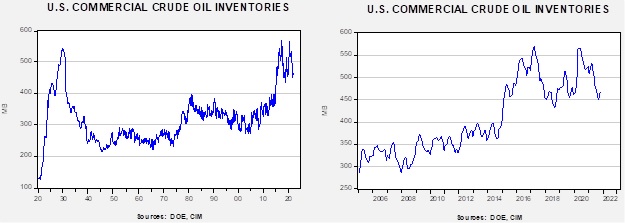
Crude oil inventories fell 2.1 mb compared to a 3.4 mb draw forecast. The SPR declined 1.3 mb, meaning the net draw was 3.5 mb.
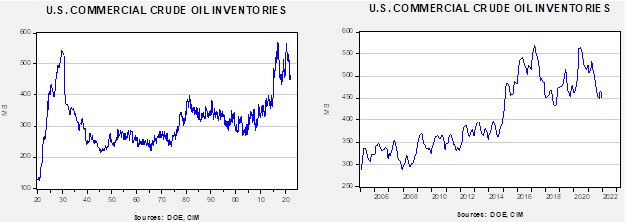
In the details, U.S. crude oil production was unchanged at 11.8 mbpd. Exports fell 0.4 mbpd, while imports declined 0.9 mbpd. Refining activity rose 0.1%.
(Sources: DOE, CIM)
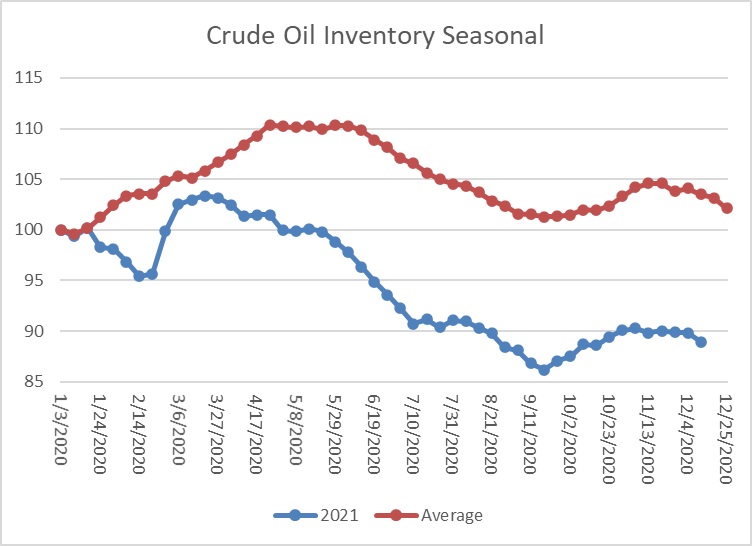
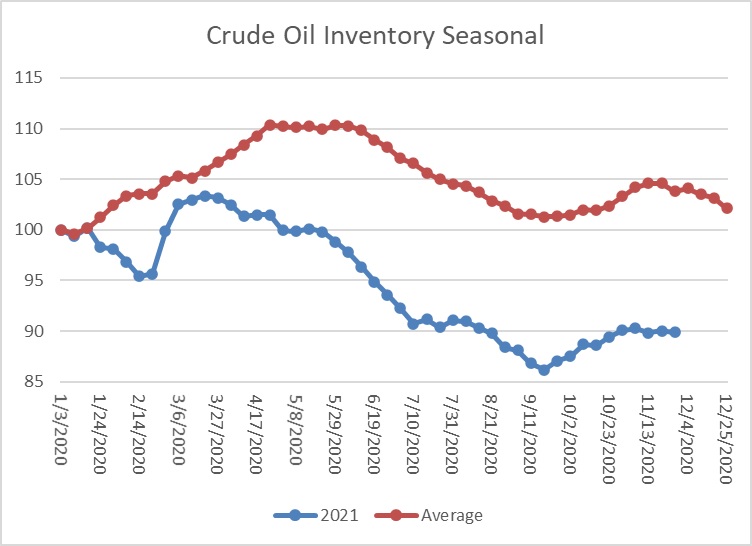
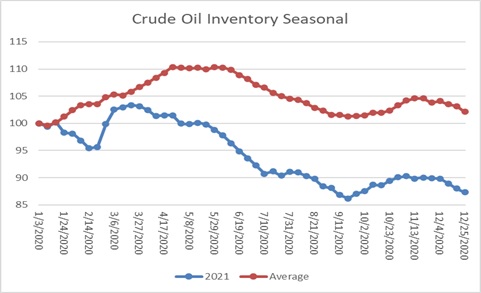
This chart shows the seasonal pattern for crude oil inventories. Next week, we will reset the chart for 2022. The key element to watch is to determine whether inventories follow the usual seasonal pattern, or, like last year, stockpiles decline and even “catch up” to usual levels of inventory.
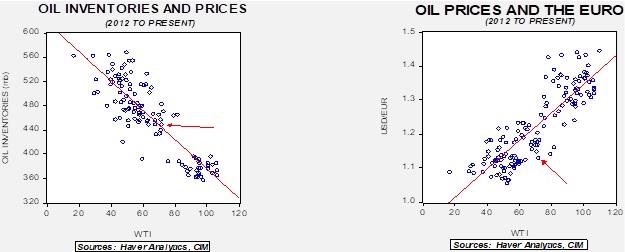
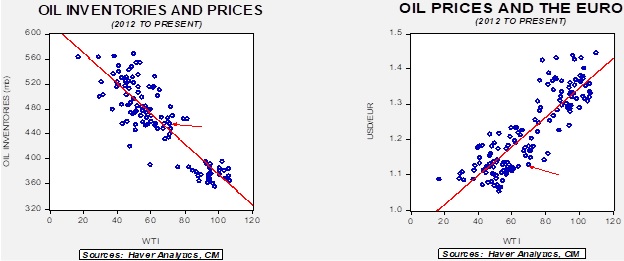
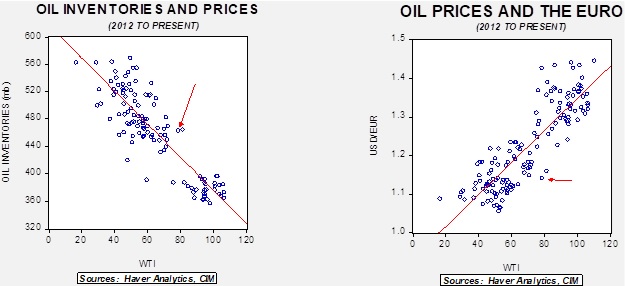
Based on our oil inventory/price model, fair value is $68.64; using the euro/price model, fair value is $52.64. The combined model, a broader analysis of the oil price, generates a fair value of $60.51. The recent decline in oil prices has brought the market closer to fair value. Dollar strength remains a bearish factor, and the SPR release has eased the bullish pressure from falling stockpiles. Fears of future supply tightness remain a bullish factor.
Market news:
- Tensions between the U.S. and China have escalated in recent years. However, the U.S. and Chinese economies remain closely tied. This is evident in two areas. China’s attempts to move from coal (China’s air quality is terrible, but coal is cheap) to natural gas has made U.S. LNG attractive. Recently, CNOOC Limited (883, HKD, 8.09) signed a 20-year LNG contract for U.S. natural gas. At the same time, China’s dominance in solar panels means that any attempt to source this product elsewhere or from non-Chinese companies is likely futile.
- Although U.S. oil production remains well below previous peaks, the Dallas FRB surveys suggest that oil firms in its district are preparing to lift output. This goal will face pressure from rising costs and financing hurdles. The expected nominee for the FOMC’s vice-chair for supervision, Sarah Bloom Raskin, strongly supports financial restrictions to address climate change. She isn’t alone. The OCC argues that bank loans to energy companies could put the financial system at risk. Environmental activists are also increasing pressure on publicly traded energy firms. Although high prices usually provide incentives for increased output (and to some extent, the White House hopes this will occur), the reality is that oil firms are facing ever-increasing hurdles to expanding output.
- Concerns about falling future demand have also changed the behavior of U.S. oil firms. They show signs of generating cash flow instead of focusing on expanding production.
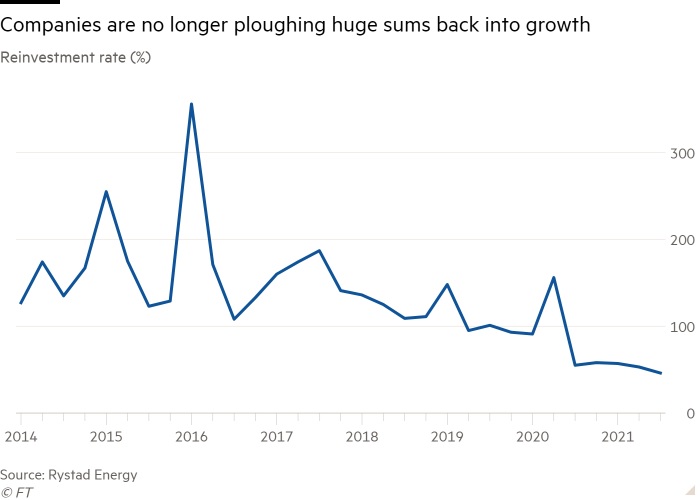
(Source: FT)
- OPEC+ has agreed to boost production by 0.4 mbpd next month, assuming the omicron variant won’t dent demand significantly.
- The U.S. adjusted the auto fleet standards to an average of 55 mpg by 2026, up from 43 mpg previously. These goals tend to be adjusted from administration to administration, so a GOP-led White House could reduce them in the future. For automakers, there is a risk of not making the investment to boost mileage and, regardless of who is in power, we expect cars to see steadily improved mileage standards.
- We also note that car company stocks seem to react positively to news of firms expanding EV capacity. If the surges hold up, it will incentivize firms to expand production capacity further.
Geopolitical news:
- The war in Yemen continues. So far, it hasn’t led to lasting disruption of oil supplies, but the risk of such an event remains a possibility. In 2021, the Houthis, who oppose the KSA’s intervention in the Yemen civil war, doubled their attacks on Saudi Arabia. Iran supports the Houthis; the U.S. Navy has seized weapons bound for Yemen to support this group.
- The KSA has started making ballistic missiles with China’s aid. Iran has been developing such missiles for years. However, the Saudis, likely fearing the steady withdrawal of the U.S. from the region, have apparently decided they need their own ballistic missile capacity to offset Iran’s capability.
- Turkey’s economy is under stress. Rising inflation and heterodox policy responses raise worries that the country could spiral into hyperinflation. A major element of Turkey’s economic problem is persistent current account deficits, which are funded by draining foreign reserves or by attracting foreign investment. The “textbook” response to Turkey’s problem is to raise interest rates, which not only depresses domestic consumption (usually narrowing the current account deficit), but the higher interest rates can attract foreign investment. President Erdogan has made it clear he won’t support higher interest rates, which is a factor in the current turmoil. One way to resolve this problem is to attract foreign investment by some other means. The current problems in Turkey, coupled with the heterodox economic policies, likely limit private investment to only the bravest and risk tolerant. Nevertheless, foreign government investors might respond to Erdogan for geopolitical reasons rather than merely economic ones. We note that, despite the murder of Jamal Khashoggi in Turkey, which infuriated Erdogan, the Turkish president is traveling to Riyadh next month to woo investment from Saudi Arabia. Why the thaw? We suspect that nations in the region are trying to build a united front against Iran and thus are willing to overlook earlier animosities.
Alternative energy/policy news:
- The EU is considering naming natural gas and nuclear power as “sustainable” fuels. German Greens oppose this label. This is important because if these fuels do get the sustainable moniker, it would support expanded investment.
- Hydrogen remains a potential replacement for fossil fuels. Unfortunately, at present, most hydrogen comes from fossil fuels (natural gas is the largest source). Namibia is laying claim that it could become a source of green hydrogen. Most high school chemistry classes show students how to crack water to derive hydrogen and oxygen. But, to use electrolysis to derive hydrogen from water requires significant levels of energy. If one can generate this energy from renewable sources, such as wind or solar energy, it might be possible to create hydrogen cleanly. Namibia has ample sunlight (300 days per year on average) and strong prevailing winds that could make the country a low-cost producer of green hydrogen.
- Bolivia has the potential to become a major source of lithium, currently a key element in EV batteries. However, local politics and competing outside interests have tended to thwart development.
- We have been tracking developments in geoengineering for some time. Geoengineering is the process of using interventions to achieve a climate goal. One example would be to disperse particles into the atmosphere to mimic a volcanic eruption; the particles would reflect sunlight into space, cooling the planet. There are other potential interventions as well. Geoengineering is controversial. No one knows for sure whether it works or what side effects it might cause, but an experiment is being considered as soon as mid-2022 to see if geoengineering works.
- Another technological fix would be carbon capture; the goal would be to “suck” CO2 out of the atmosphere. So far, current technologies are not large enough to make a difference. There are also worries among some environmentalists that the promise of carbon capture would discourage strong actions to reduce fossil fuel consumption.
- Battery storage is expanding rapidly as a way to smooth out electricity flow from renewables.