

Asset Allocation Weekly – An Update on Gold (December 3, 2021)
by the Asset Allocation Committee | PDF
Gold moved steadily higher from the late summer of 2018 into August 2020. Prices then declined toward 1,700 and have since traced out a trading range between 1,700 and 1,900. In this report, we will update our views on the metal.
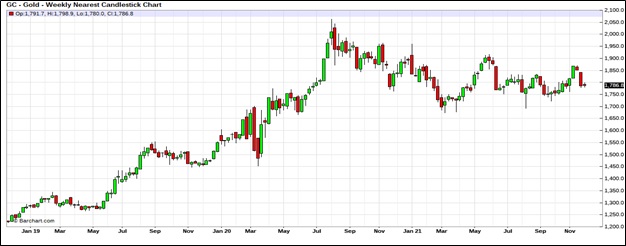
(Source: Barchart.com)
We have been holding gold in our asset allocation portfolios since 2018, although we have diversified our commodity holdings by adding a broader commodity ETF alongside our gold position.
The long-term outlook for gold remains positive. Our basic gold model, which uses the balance sheets of the Federal Reserve and the European Central Bank, the EUR/USD exchange rate, the real two-year T-note yields, along with the U.S. fiscal deficit relative to GDP, suggests prices remain undervalued.
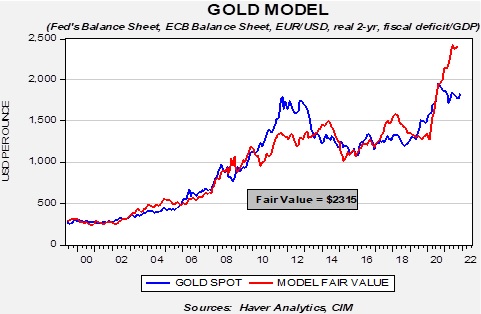
Gold prices started deviating from the model around July 2020. When a model starts to “go wrong,” it makes sense to see if something has changed.
We noted earlier this year that in August 2020, the correlation between bitcoin and gold “flipped” from positive to negative.
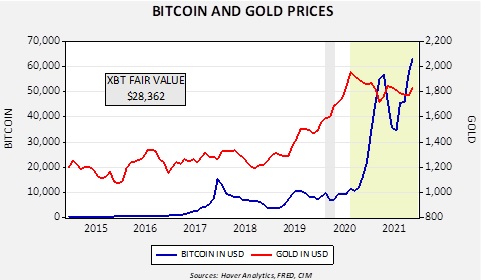
Cryptocurrencies share a similar characteristic with gold; they both provide a store of value. They are somewhat positively correlated since 2015 (+66%) but beginning in August 2020 (shown in light green on the chart), gold and bitcoin are inversely correlated to the tune of 83.7%. This change of sign suggests that the two are now seen as competing products.
Through some data adjustments, we added bitcoin to the base model for gold. The results still suggest gold is undervalued but is less so compared to the base model.
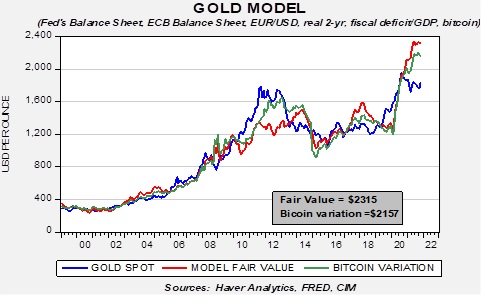
The bitcoin’s coefficient sign is negative, suggesting that falling bitcoin prices would be bullish for gold prices. The other takeaway from the model is that even with the addition of bitcoin, gold is attractive at current levels. Given the risk of a regulatory crackdown on bitcoin, there is a risk that bitcoin prices could decline, which should be supportive of gold.