by Bill O’Grady, Thomas Wash, and Patrick Fearon-Hernandez, CFA | PDF
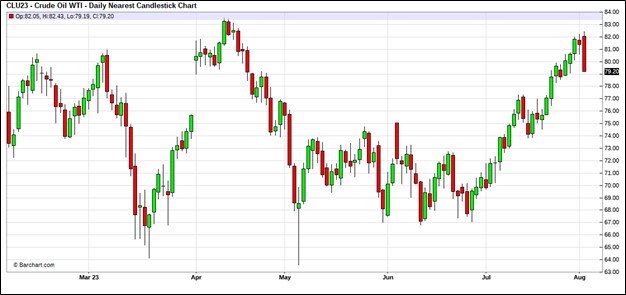
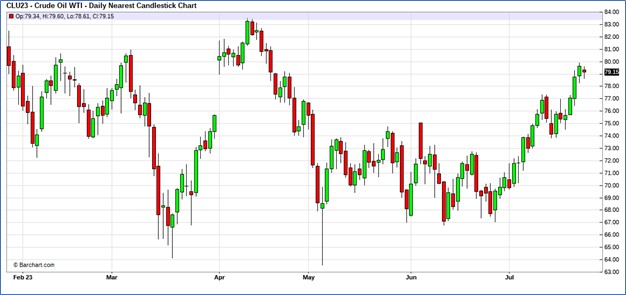
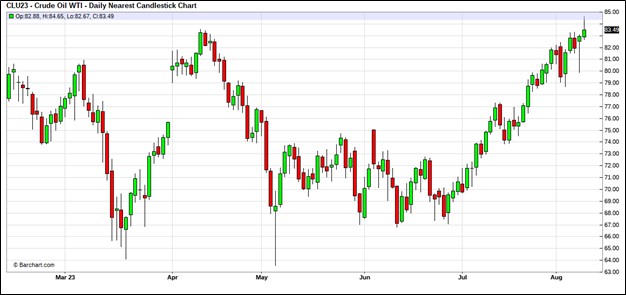
Oil prices did break out of the trading range but were unable to maintain the uptrend. We suspect the recent pullback is corrective in nature and not the start of a major selloff.
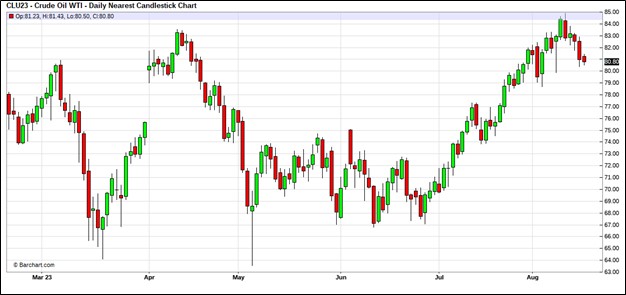
(Source: Barchart.com)
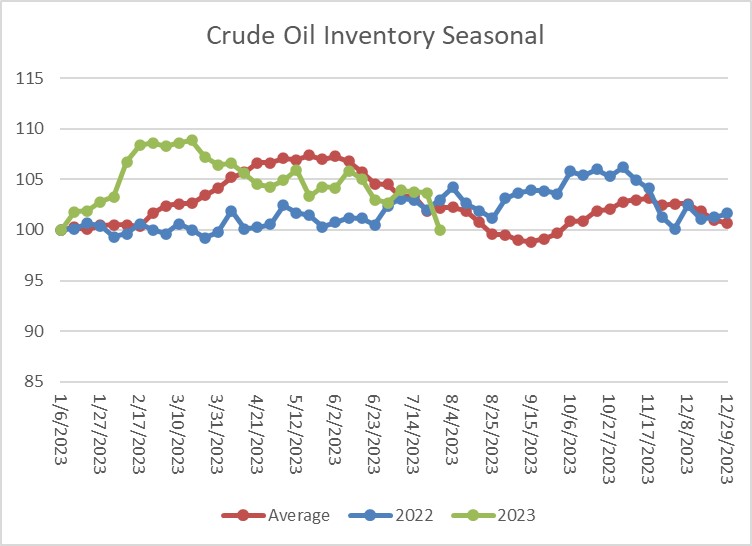
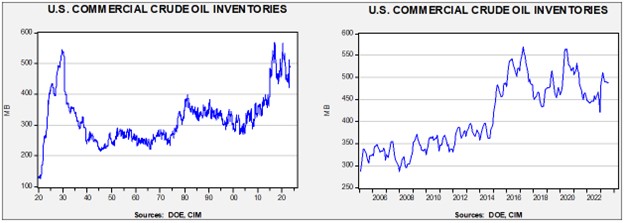
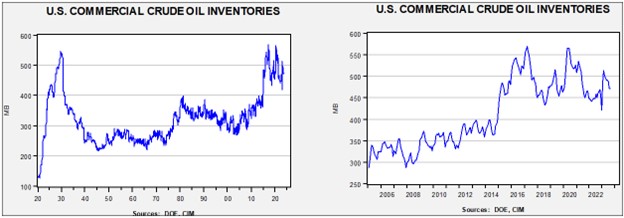
Commercial crude oil inventories fell 6.0 mb, much lower than the 2.3 mb build forecast. The SPR rose 0.6 mb which puts the net build at 5.4 mb.
In the details, U.S. crude oil production rose 0.1 mbpd to 12.7 mbpd. Reported production has been rising, but there are also reports arguing that further increases may be difficult. Exports rose 2.2 mbpd, while imports rose 0.5 mbpd. Refining activity rose 0.9% to 94.7% of capacity, the highest level since early June.
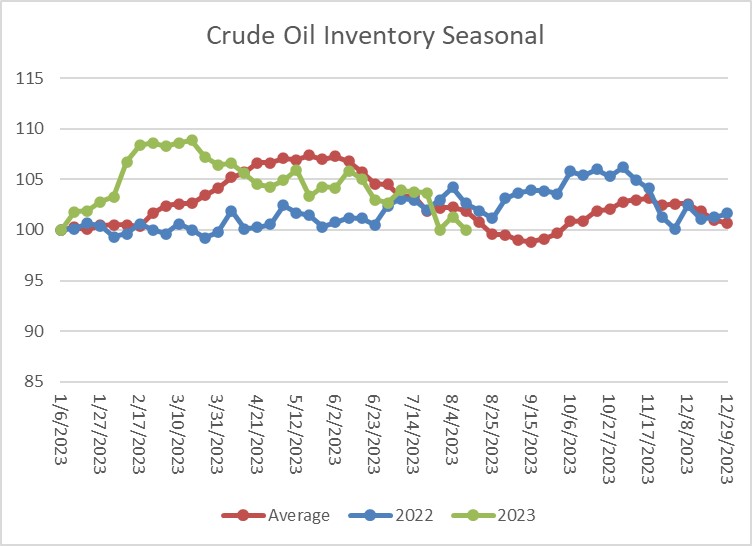
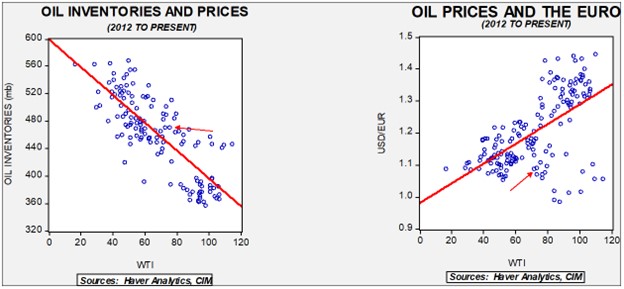
(Sources: DOE, CIM)
The above chart shows the seasonal pattern for crude oil inventories. The last decline is consistent with seasonal patterns. Inventories remain a bit below their seasonal average.
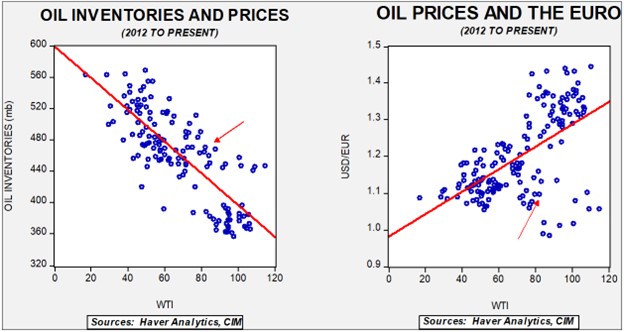
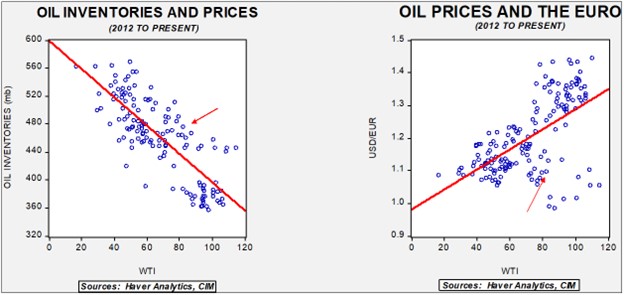
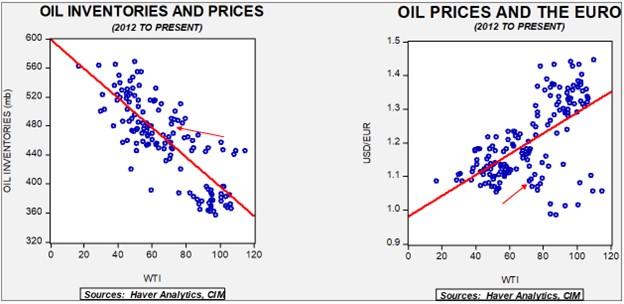
Fair value, using commercial inventories and the EUR for independent variables, yields a price of $66.20. Commercial inventory levels are a bearish factor for oil prices, but with the unprecedented withdrawal of SPR oil, we think that the total-stocks number is more relevant.
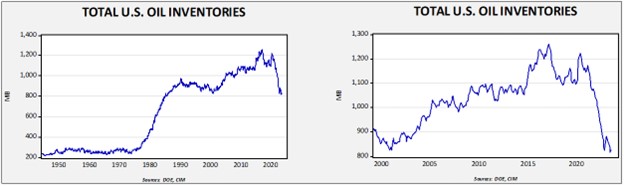
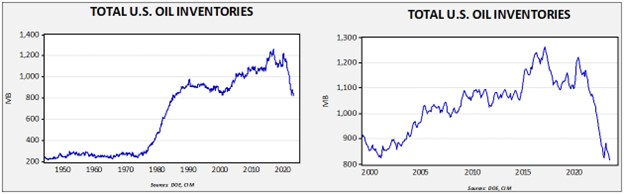
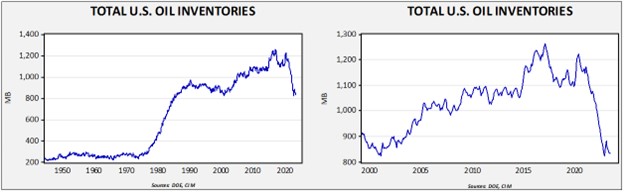
Since the SPR is being used, to some extent, as a buffer stock, we have constructed oil inventory charts incorporating both the SPR and commercial inventories.
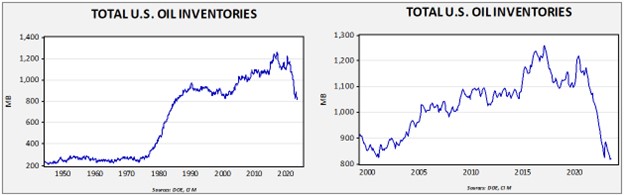
Total stockpiles peaked in 2017 and are now at levels last seen in late 1985. Using total stocks since 2015, fair value is $93.89.
Market News:
- The threat of a strike by Australian LNG workers led to a massive jump in European natural gas prices. Prices had been weak because European inventory levels were seen as elevated. The rise shows how vulnerable Europe remains due to the loss of Russian supplies.
- Drought is threatening water levels in the Panama Canal. If they become severe enough, it may affect global LNG flows.
- The IEA notes that, despite efforts to transform the energy sector, oil demand is hitting new records. The energy transition has dampened investment in oil and gas, and therefore, if demand continues to rise, oil prices will likely rise as well.
- A couple of weeks ago, we noted that temperatures were likely being affected by the sunspot cycle and El Niño. We can now add volcanic activity to the list. Volcanic eruptions tend to spew particulates into the atmosphere, which reflect sunlight back to space and cool the planet. We are currently seeing a large eruption in Sicily.
- However, not all eruptions have the same result. A deep water eruption in Tonga may have had the opposite effect.
- A new heatwave is hitting the Pacific Northwest.
Geopolitical News:
- There are further indications that the Kingdom of Saudi Arabia (KSA) and Israel are planning to normalize relations. Washington has been taking an active role in encouraging this development. It’s not a done deal yet, but there is evidence of progress. Making a deal would help build an anti-Iran alliance.
- The KSA appointed a non-residential ambassador to the “state of Palestine.” Since no state actually exists, this action is more for show, but it may give the KSA a vehicle to criticize Israel’s policies against the Palestinians.
- The U.S. and Iran appear to be close to a prisoner deal that will free five Americans currently detained in Iran. In exchange, Washington will unfreeze $6.0 billion of Iranian assets. The Biden administration continues in its quest to resurrect the JCPOA; we continue to doubt this will ever occur. However, there is more to the deal than is being discussed in the press—Peter Zeihan has his take here. There is still a good chance this deal will fall through as there is strong opposition on both sides.
- We note the U.S. has asked Iran to stop selling drones to Russia.
- While these indirect talks continue, naval tensions in the Persian Gulf remain
- The war in Ukraine has disrupted global supply chains. As part of this situation, we note that oil majors have suffered large losses by exiting Russia.
- Despite the war, the West remains dependent on Russian nuclear fuel.
- Sanctions generally leak. One way that Russia and India have avoided sanctions was to price Russian oil sales under the price cap but inflate shipping costs. A recent report suggests this workaround may have added a billion dollars to Russian oil revenues.
- Despite Russia’s aggressive actions to avoid sanctions, the RUB has been rapidly depreciating. The currency weakness does suggest problems in the Russian economy. To defend the currency, the Russian central bank lifted its policy rate 350 bps. The currency crisis has been raised to the presidential level.
- The war in Ukraine has severely damaged demand for industrial gases in Europe. Weak economic growth and fears of higher prices have depressed industrial activity.
- President Xi encouraged party members to work on ensuring energy security. We have noted that China has been engaging in an “all of the above” energy strategy, looking to expand coal, nuclear, hydro, oil, and natural gas resources. As with nearly everything in China, Xi framed the energy situation in terms of national security.
- Iraq’s oil exports to the U.S. have recently surged.
Alternative Energy/Policy News:
- In the extraction process, it is not unusual for byproducts to be produced. When mining for copper, nickel or silver is also often extracted. When drilling for oil, natural gas is often found as well. Lithium is often a byproduct of oil and gas drilling, and with lithium prices rising and demand strong, oil companies are starting to try to capture lithium in the drilling process. Where does the lithium come from? When drilling for oil or gas, a normal byproduct is salt water mixed with oil, and this brine contains lithium.
- There are two competing technologies for lithium-ion batteries. One uses lithium, nickel, manganese, and cobalt, and another uses lithium, iron, and phosphate. This article is a primer on the two different types.
- S. metals demand is being boosted by the Inflation Reduction Act. Research suggests that demand for these metals likely exceeds production capacity.
- As the energy transition continues, Africa’s mineral wealth is attracting the attention of both the U.S.-led and China-led blocs.
- In the U.S., EV sales remain healthy, but there is growing dissatisfaction with the charging infrastructure. Without resolution, this could stall sales.
- Although Mongolia is landlocked, as we noted in a recent report, it has been trying to foster an independent foreign policy away from Russia and China. The U.S. is supporting Mongolian exports of rare earths. It will be interesting to see if China begins to interfere with the trade.
- In Brazil, BYD (BYDDY, $66.43) is taking control of a large Ford (F, $12.30) auto factory, providing further evidence that China’s EV industry is making global inroads.
- Last week, we noted that China was using pumped storage for energy production. Beijing has announced a new pumped storage project in the Gobi Desert.
- The buildout of electricity transmission lines is a key element in expanding renewable energy. Often, such projects pit environmentalists against one another.
- Supermajor oil companies are becoming interested in direct air capture, which would pull carbon out of the atmosphere directly.
- A Montana judge ruled that the state’s approval of fossil fuel projects was unconstitutional because environmental factors were not taken into account. Although the news is getting lots of attention, the ruling was rather narrow and may not set a precedent.
- There is an underlying tension between rapidly building out the alternative energy industry and encouraging unionization. The UAW is pressing for union membership, whereas firms are hoping to avoid organized labor.
- Much of the investment in alternatives is being done in “red” states.
 (Source: Barchart.com)