by the Asset Allocation Committee | PDF
Early 2023 served as a stark reminder that correlations can break down when least expected. Last year, a decline in the copper/gold ratio led many investors to anticipate a fall in longer-term yields, particularly for the 10-year Treasury note. However, these expectations were shattered as yields not only increased but surged to multi-decade highs by October. This episode underscores the challenge of relying too heavily on old assumptions. In this report, we’ll delve into the dynamics between the copper/gold ratio and 10-year yields and explore whether this historical connection has been permanently severed.
The copper-to-gold ratio is a closely watched indicator of investor risk sentiment. This ratio compares the price of copper, an industrial metal heavily used in construction and manufacturing, to the price of gold, a traditional safe-haven asset. A rising ratio generally signals investor optimism about economic growth. As economic activity picks up, demand for copper rises and pushes its price higher relative to gold. Conversely, a declining ratio suggests investor pessimism and a potential economic slowdown. This could be due to fears of recession or other economic troubles, leading investors to seek the perceived safety of gold.
As shown in the chart below, a rising copper-to-gold ratio has historically coincided with increasing long-term Treasury yields. This reflects investor expectations of accelerating economic growth, which can lead to inflation. To compensate for the potential erosion in bond values, investors demand higher yields on longer-term bonds. The relationship also works in the opposite direction. Investor fears of geopolitical risks or recession trigger a decline in both the copper/gold ratio and bond yields as investors seek safety in gold and US government bonds.
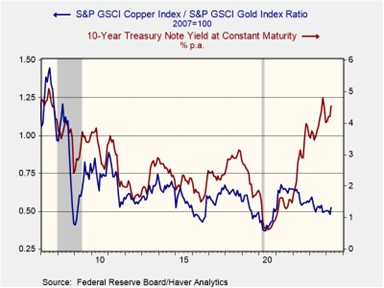
The once strong correlation between the copper/gold ratio and interest rates seems to be unraveling in the post-pandemic recovery. While the ratio initially surged with the global reopening, China’s economic slowdown has caused it to fall over the last couple of years. In contrast, the 10-year Treasury yield has climbed as stubbornly high inflation has prompted central banks to tighten monetary policy, leading to further interest rate increases. This disconnect between the traditional indicators suggests a potential shift in market dynamics.
Prior to the pandemic, investors largely operated under the assumption of a stable, low-inflation world. This fostered an environment where long-term investments were attractive, and there was minimal fear that duration risk would erode their value. Consequently, investors primarily focused on the long end of the yield curve only during periods of economic concern or during major events that might prompt the Fed to cut rates and stimulate growth. This preference for bonds during economic downturns mirrored that of gold — a safe-haven asset. As a result, both bond yields and the copper-to-gold ratio had previously moved counter-cyclically.
However, these market relationships started to change as government efforts to prevent a recession through the creation of massive deficits led to higher long-term interest rates. The issuance of new Treasurys pushed up interest rates as the market struggled to absorb the new bonds. A further contributing factor to this dynamic is the Federal Reserve’s hawkish monetary policy. The Fed’s tapering of its bond holdings has reduced a key source of demand. Additionally, recent interest rate hikes have discouraged investors from holding long-term bonds as short-term bonds offer more attractive yields.
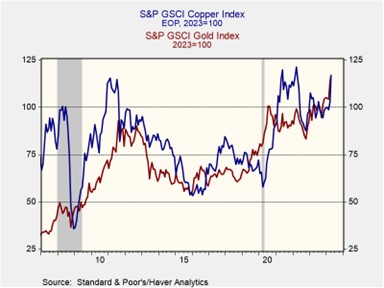
The metals market has also seen a transformation. So far this year, China’s modest industrial rebound has lifted copper prices from their 2023 lows, while the collective central bank buying of gold, spearheaded by China, has sent bullion prices skyrocketing. This unusual gold surge has offset the rise in copper prices, which explains why the ratio has been relatively subdued this year. While this trend may seem fleeting, evidence suggests emerging economies are accumulating gold as a potential hedge against the US government’s frequent use of sanctions tied to the dollar. As a result, it is possible that the copper/gold ratio could continue to move in the opposite direction of 10-year Treasury yields.
The breakdown in the relationship between the copper/gold ratio and 10-year Treasury yields likely stems from a new global economic reality. Higher deficits and inflation expectations have driven up long-term yields, while China’s slowdown and central bank gold purchases have suppressed the copper/gold ratio. A return to the prior correlation could occur if investors become confident in a return of price stability and if the accumulation of gold by foreign central banks proves temporary. However, we are doubtful of a near-term return, given persistent labor shortages, inflation pressures, and rising geopolitical tensions, particularly between the US and China.