by Bill O’Grady, Thomas Wash, and Patrick Fearon-Hernandez, CFA | PDF
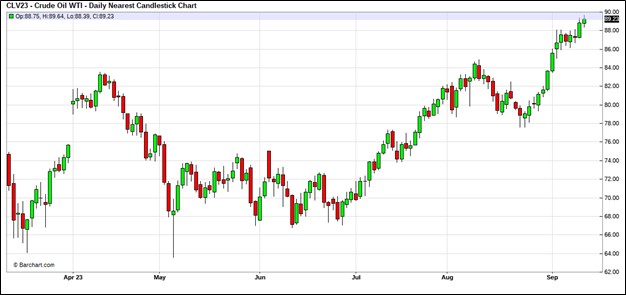
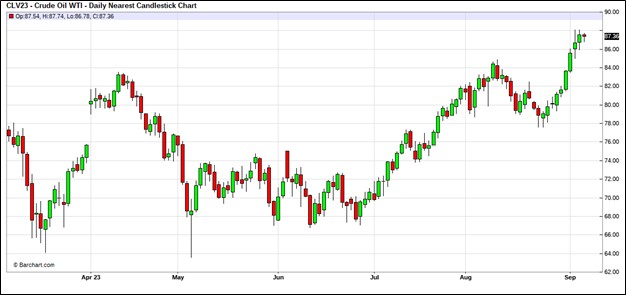
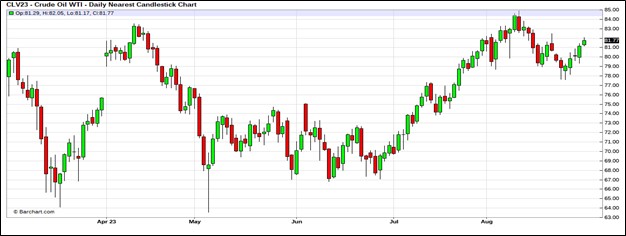
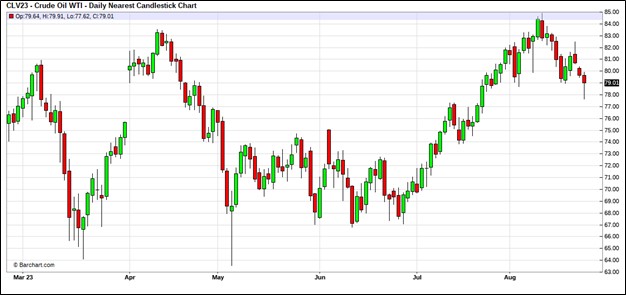
Oil prices have continued their rise, with WTI trending towards $90 per barrel.
 (Source: Barchart.com)
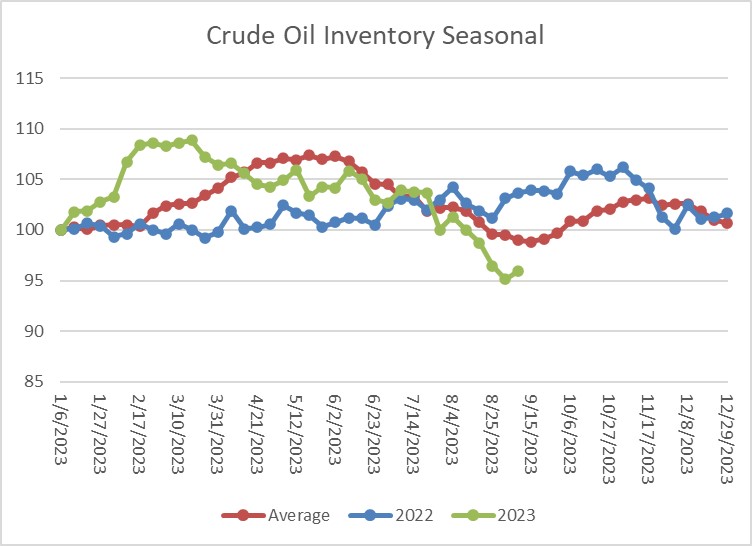
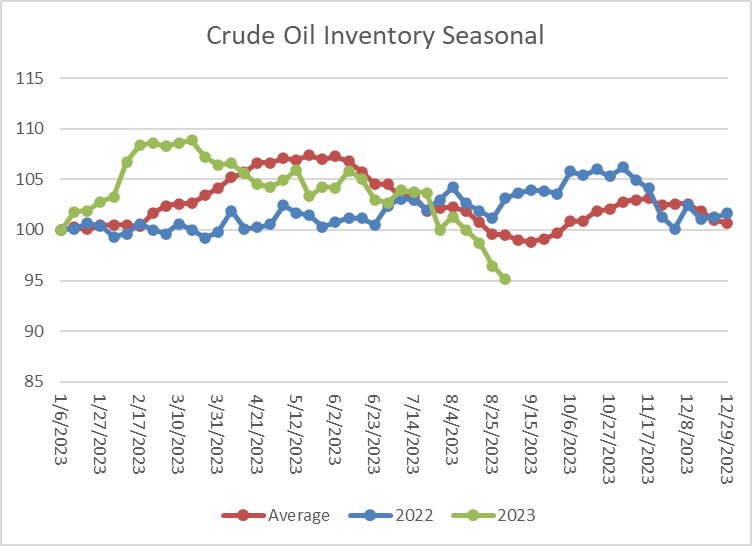
Commercial crude oil inventories rose 4.0 mb, compared to forecasts of a 2.0 mb draw. The SPR rose 0.3 mb which puts the net build at 4.2 mb (the discrepancy is due to rounding).
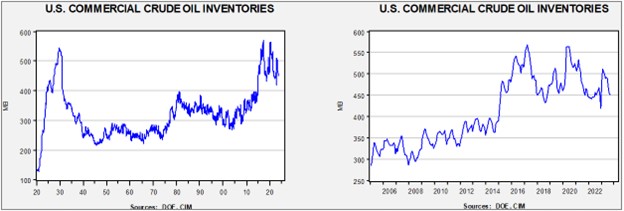
In the details, U.S. crude oil production rose 0.1 mbpd to 12.9 mbpd. Exports declined 1.8 mbpd, while imports rose 0.8 mbpd. Refining activity rose 0.6% to 93.7% of capacity.
 (Sources: DOE, CIM)
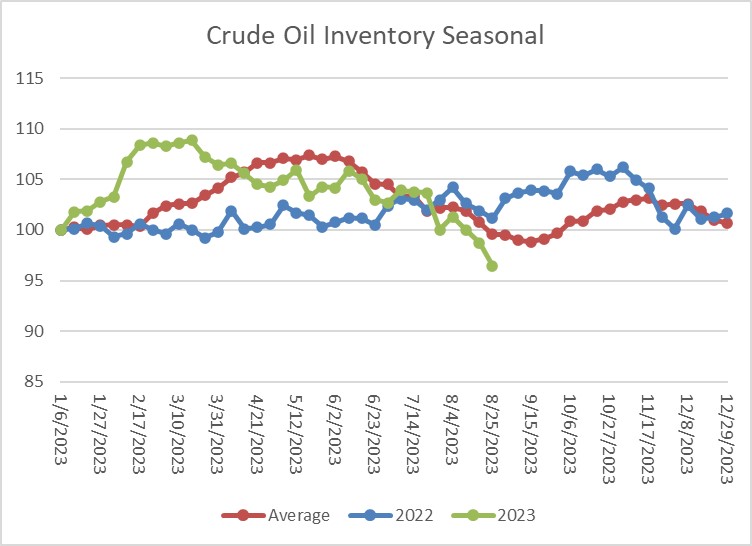
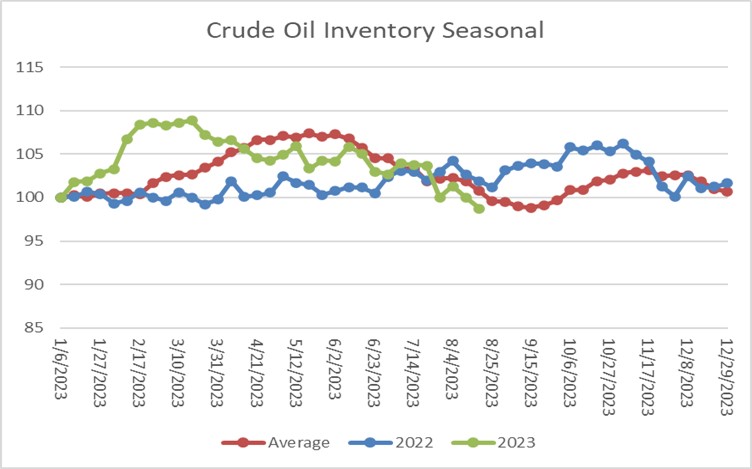
The above chart shows the seasonal pattern for crude oil inventories. Last week’s rise is mostly consistent with expected seasonal increases in crude oil stockpiles. However, the sharp drop in exports is a bit of a puzzle and if reversed next week, inventories could remain tight.
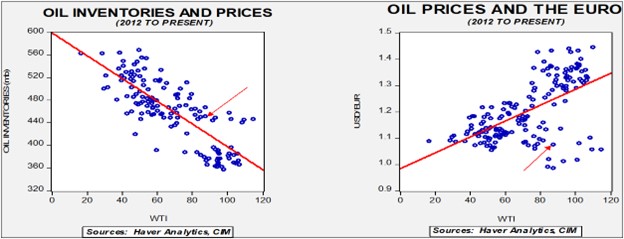
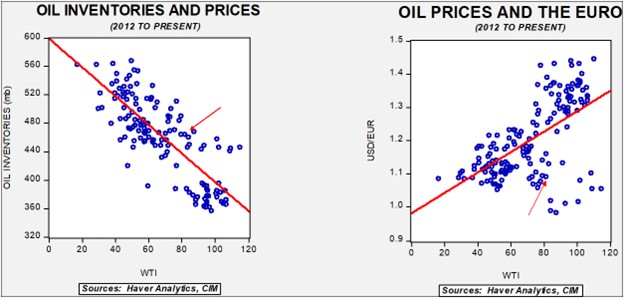
Fair value, using commercial inventories and the EUR for independent variables, yields a price of $73.30. Commercial inventory levels are a bearish factor for oil prices, but with the unprecedented withdrawal of SPR oil, we think that the total-stocks number is more relevant.
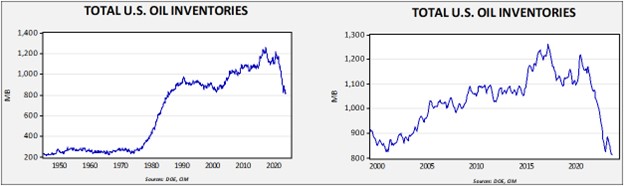
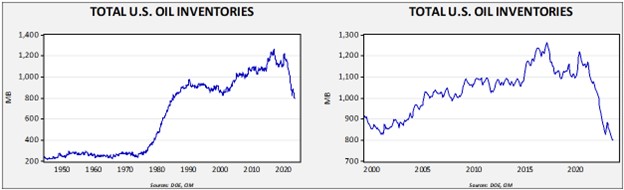
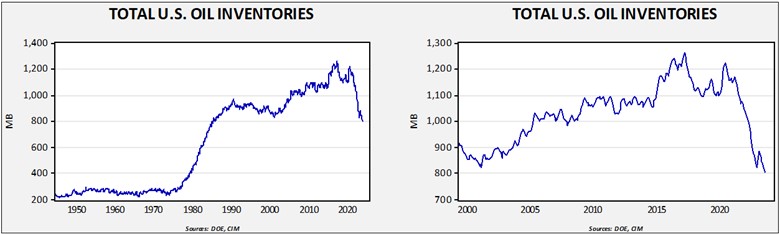
Since the SPR is being used, to some extent, as a buffer stock, we have constructed oil inventory charts incorporating both the SPR and commercial inventories.
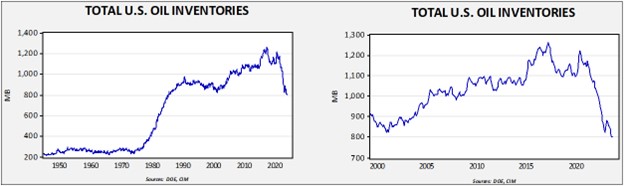
Total stockpiles peaked in 2017 and are now at levels last seen in late 1985. Using total stocks since 2015, fair value is $94.95.
Market News:
- The executive director of the IEA issued an editorial in the Financial Times where he forecast peak oil and natural gas demand would occur by the end of the decade. The increase in EVs and renewables is expected to supplant fossil fuels. Obviously, we won’t know for sure if he is correct for a few years, but this position does affect behavior. Oil and gas firms have already shifted their focus from growth to providing return to shareholders and owners. After all, how does one justify expanding production that may simply be stranded? On the other hand, if he is wrong, and demand continues to grow, the behavior of firms increases the likelihood of much higher oil prices.
- Russian refineries are planning seasonal maintenance that will allow for more oil exports but will also curtail product exports. It will be interesting to see if Russia maintains its promise to restrict oil supplies in light of this seasonal situation.
- Although the Kingdom of Saudi Arabia’s (KSA) production restrictions have supported oil prices recently, it will almost certainly weaken the economy. That’s in part due to increasing Iranian exports and rising Guyana production that will reduce the KSA’s market share. We don’t expect a change in Saudi production this year, but we wouldn’t be surprised to see an attempt to regain market share next year.
- U.S. shale producers are trying to impress investors with their improved efficiency. In the past, it was all about production, but now there is a focus on profitability. One measure of efficiency is the length of drilling laterals; in other words, getting more oil from each wellhead.
- As the odds of an Australian LNG strike loom, Chevron (CVX, $165.59) is likely to deploy a legal strategy to avert a work stoppage. Workers have already went on strike to signal their resolve. There is an element of Australian law that suggests that if two sides in a labor dispute are hopelessly deadlocked, one side can petition for arbitration and work continues. It is apparently untested, and we would be surprised if the courts give Chevron an out.
- EU natural gas prices jumped on strike news.
Geopolitical News:
- As we have noted recently, the U.S. and Iran are taking steps to improve relations. For example, frozen Iranian financial accounts held in South Korea have been allowed to be sent to Tehran in exchange for prisoners. The prisoner swap has been officially approved this week. However, that isn’t keeping U.S. officials from seizing Iranian oil that violates American sanctions. We note that the owner of a ship holding Iranian oil has admitted he broke sanctions in court.
- If Saudi/Iranian relations continue to improve, is there a chance that the KSA will soften its stance on Hezbollah? And will that affect the potential for an Israeli/KSA normalization?
- There is a political cost to this deal. Iran is generally unpopular and doing anything that smacks of appeasement raises concerns.
- Despite reports that Iran is slowing down its nuclear enrichment activities, the IAEA continues to report that Iran has expanded its stock of near-weapons grade uranium.
- One sign that the markets believe there will be a thaw with Venezuela is that it’s long moribund bond market is rallying.
- There are Iranian Kurdish groups opposed to the government in Iran that have taken refuge in Iraq. A recent agreement between Tehran and Baghdad calls for Iraqi officials to disarm these groups. It is unclear if Iraq will actually follow through on this promise, as it might trigger an armed response from Iraqi Kurds. Although the Kurds are themselves divided, being attacked by an outside force might just unify the Kurds in the face of a common enemy.
- Although Russian oil sales to Europe have been curtailed, they are not eliminated. Small EU nations tend to be buyers still. The Czech Republic is increasing its purchases of Russian oil, for example.
Alternative Energy/Policy News:
- MIT has announced a new carbon capture technology using an electro-chemical process that uses less energy. Current methods tend to require high levels of energy and if this energy comes from fossil fuels, the gains are mostly cosmetic.
- Amazon (AMZN, $141.58) is making a major investment in direct carbon capture. We are seeing a trend in large companies backing this technology.
- Geothermal energy is poised for aggressive development. This form of energy is clean and mostly non-controversial. The problem has always been that there are limited areas where such energy can be economically exploited. However, new methods of extracting this power are being developed which, if successful, will lower costs and make the power more widely available.
- The U.S. and the KSA are in talks to secure and develop EV metals in Africa. This unusual partnership is being fostered by fears that China will extend its dominance over these metals.
- Malaysia is set to ban the exports of rare earths, demanding that firms build processing facilities in country for the finished product.
- Not only are cars going electric, but large trucks are too, although progress has been much slower due to the weight of batteries. Elon Musk is looking at building out a massive recharging network for such vehicles but wants public sector support.
- China’s dominance in photovoltaic (PV) is leading to lower prices for solar panels, essentially undercutting producers in the U.S. and Europe. EU producers are warning that they will be facing bankruptcy without state support, either from tariffs or subsidies.
- In the U.S., support for the PV industry as part of the Inflation Reduction Act hasn’t yet translated into manufacturing, but it is expected to expand solar power in the U.S.
- The annual U.K. wind auction failed to gather any winning bids this week. Rising costs for building facilities is said to be the culprit.
- The EU is just a couple of weeks away from implementing its carbon border taxes. Companies in Europe are scrambling to adjust to higher priced imports.
- As China exports low cost EVs to Europe, the EU announced it will investigate the role of Chinese government subsidies in this surge. Such studies are usually a precursor to dumping tariffs.
 (Source: Barchart.com)
 (Sources: DOE, CIM)
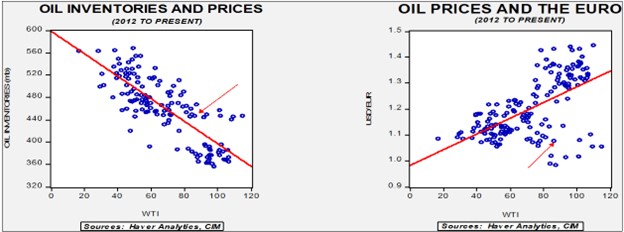
 (Source: Barchart.com)
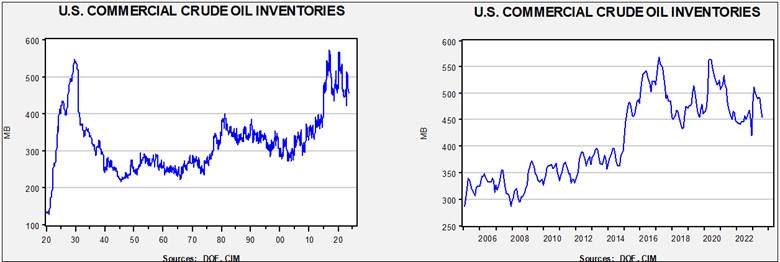
 (Sources: DOE, CIM)
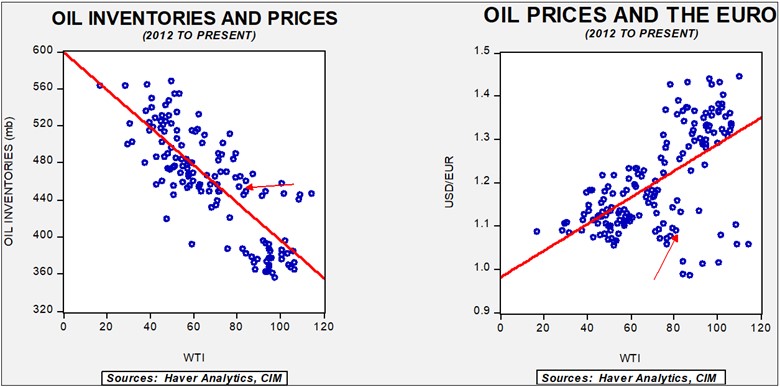
 (Source: Barchart.com)
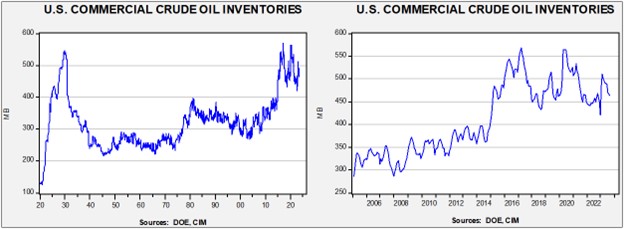
 (Sources: DOE, CIM)