

Tag: oil
Asset Allocation Bi-Weekly – #113 “U.S Oil Production at a Record High” (Posted 2/5/24)
Bi-Weekly Geopolitical Podcast – #35 “The Oil Weapon Returns” (Posted 10/2/23)
Bi-Weekly Geopolitical Podcast – #31 “The Issue of the Terms of Trade” (Posted 6/16/23)
Bi-Weekly Geopolitical Podcast – #24 “Enter the Petroyuan” (Posted 3/6/23)
Quarterly Energy Comment (December 17, 2019)
by Bill O’Grady
The Oil Market
Since June, oil prices have held mostly within a range of $50 to $60 per barrel.
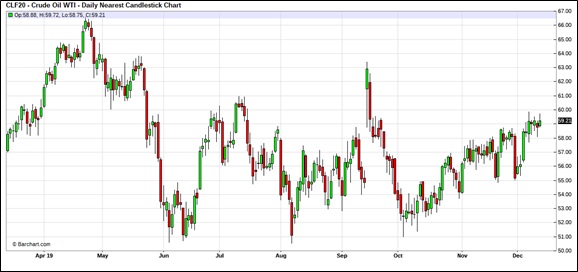
After a sharp decline in prices from late May into early June, due in part to a contra-seasonal build in inventories, inventories fell and oil prices rebounded. Rising tensions with Iran added to the lift in prices in September. Since then, we have seen a retest of the lower end of the range and a steady recovery. Soon after year-end, we usually see a seasonal rise in inventories, which tends to weigh on prices. However, with the advent of exports, that seasonal pattern has become suspect. For example, last year we didn’t see the usual increase in stockpiles.
Thoughts on Oil Demand
In general, forecasting demand is not usually a priority in commodity analysis. The shape of most short-run commodity demand curves is inelastic, which means that quantity isn’t very sensitive to price. Demand inelasticity means that a small change in supply can have outsized effects on price. It is because of that structure that commodity analysts tend to focus on supply. That being said, demand is important over the long term. For example, the effect of environmental regulations and consumer sentiment has adversely affected coal demand and severely depressed prices. The price of coal didn’t fall because supply expanded; it fell because demand declined.
Quarterly Energy Comment (August 27, 2019)
by Bill O’Grady
The Oil Market
Since June, oil prices have held within a range of $50 to $60 per barrel.
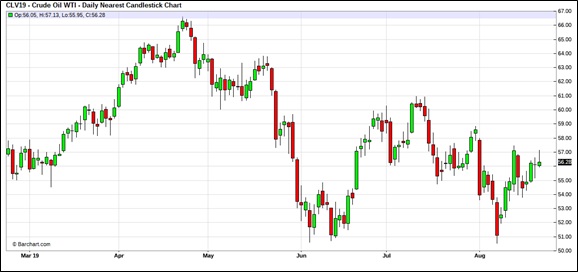
After a sharp decline in prices from late May into early June, due in part to a contra-seasonal build in inventories, inventories fell and oil prices rebounded. Rising tensions with Iran added to the lift in prices. Since then, we have seen a retest of the lower end of the range and another bounce. Unfortunately, we are heading into a weak demand period for crude oil as the summer vacation season comes to a close. Therefore, the lower support level may get tested again.
A Tale of Two Variables
Although there are several variables that affect the price of oil, within the business cycle the two we focus on are the dollar and commercial crude oil inventories. As with many situations, there are data accommodations that are necessary. Oil inventories can be problematic because, throughout history, the correlation between stockpiles and prices can flip.
Quarterly Energy Comment (March 21, 2019)
by Bill O’Grady
The Market
Oil prices have been volatile over the past few months.
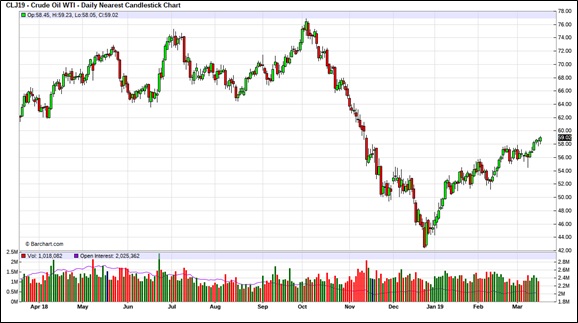
In October, OPEC producers increased output in anticipation of U.S. sanctions on Iran. However, the Trump administration granted more waivers for Iranian exports than anticipated, leading to more oil supply. As the above chart shows, prices plunged, falling from $78 per barrel to near $42 per barrel. OPEC + Russia have since taken barrels off the market in a bid to boost prices. Thus far, they have had some success in this effort but, clearly, we have not seen a full recovery in prices.
Prices and Inventories
Inventory levels remain below their 2017 peak but are still above what we would consider normal levels, below 400 mb. Oil inventories rose sharply in 2015 as U.S. output rose due to shale production. Unfortunately, the U.S. had regulations in place that limited oil exports to Canada and Mexico. As these regulations were lifted, allowing for expanded oil exports, stockpiles have declined.
Quarterly Energy Comment (September 7, 2018)
by Bill O’Grady
The Market
Since mid-Q1, oil prices have ranged from a low of around $64 to a high of $71 per barrel.
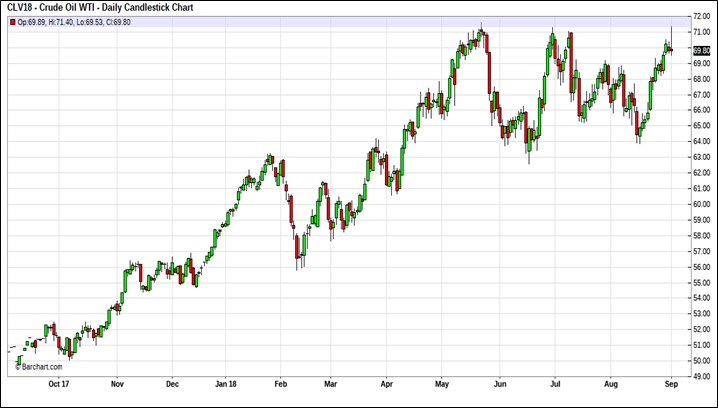
Prices remain elevated, supported by OPEC production discipline, production problems in several OPEC nations, fears of new Iran sanctions and stable global oil demand.
Prices and Inventories
Inventory levels remain elevated but have clearly declined from last year’s peak.
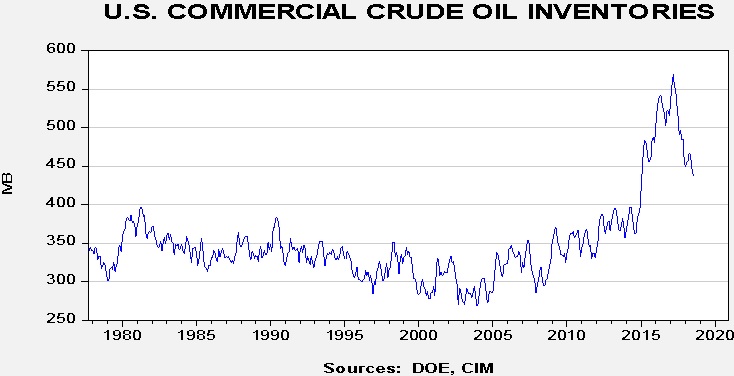
From the late 1970s into mid-2014, U.S. commercial crude oil inventories ranged between 275 mb and 400 mb. However, from mid-2014 into 2017, rising U.S. production led to a major increase in stockpiles.