

Tag: energy
Asset Allocation Bi-Weekly – China Cuts Its Energy Imports (June 15, 2026)
by Patrick Fearon-Hernandez, CFA | PDF
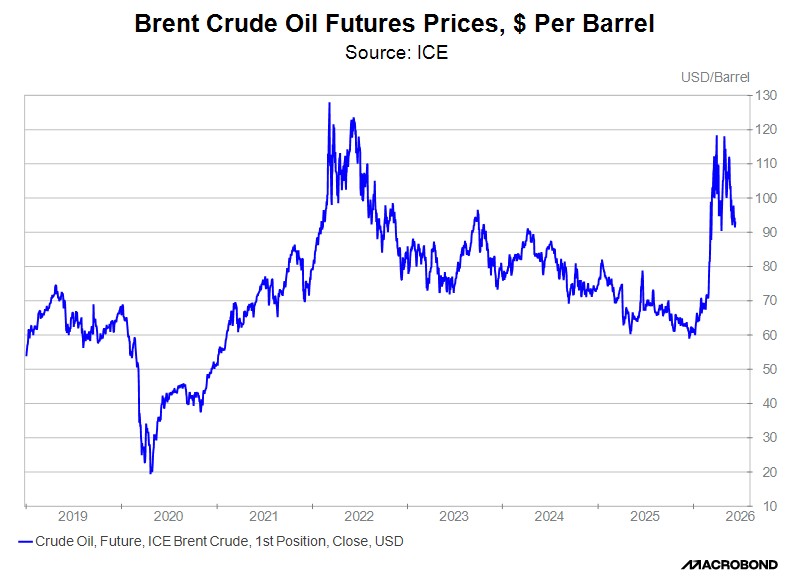
As we’ve noted before, the most immediate economic and financial market risk from the Iran war is the possibility of further price hikes for oil, natural gas, and some other commodities that depend heavily on shipping through the Strait of Hormuz. Because of the war, the strait has now been essentially shut down for more than three months. Global energy and other commodity prices have indeed increased. As shown in the chart below, near Brent crude oil futures prices jumped approximately 50% in the weeks after the war started on February 28. However, the escalation in prices has been relatively contained and prices have even started to fall back recently. That’s despite assurances from economists and energy analysts that prolonged closure of the strait would inevitably lead to further price hikes. In this report, we show that a massive pullback in Chinese energy imports has probably been a key reason why prices haven’t risen as much as feared, at least so far. We also show that the pullback in Chinese energy demand has helped set the stage for recent stock market dynamics.
The unexpected pullback in energy prices was a mystery in recent weeks, especially since official data and anecdotes suggested that the closure of the strait was forcing countries around the world to use up their inventories. For example, the International Energy Agency warned in its May market review: “The world is drawing oil inventories at a record pace as importing countries confront unprecedented disruptions to Middle Eastern supplies.” According to the IEA, global oil stocks had plummeted by almost 250 million barrels since the start of the war, with even steeper declines if stranded stockpiles in the Middle East are excluded. Such inventory depletion would normally be expected to boost prices.
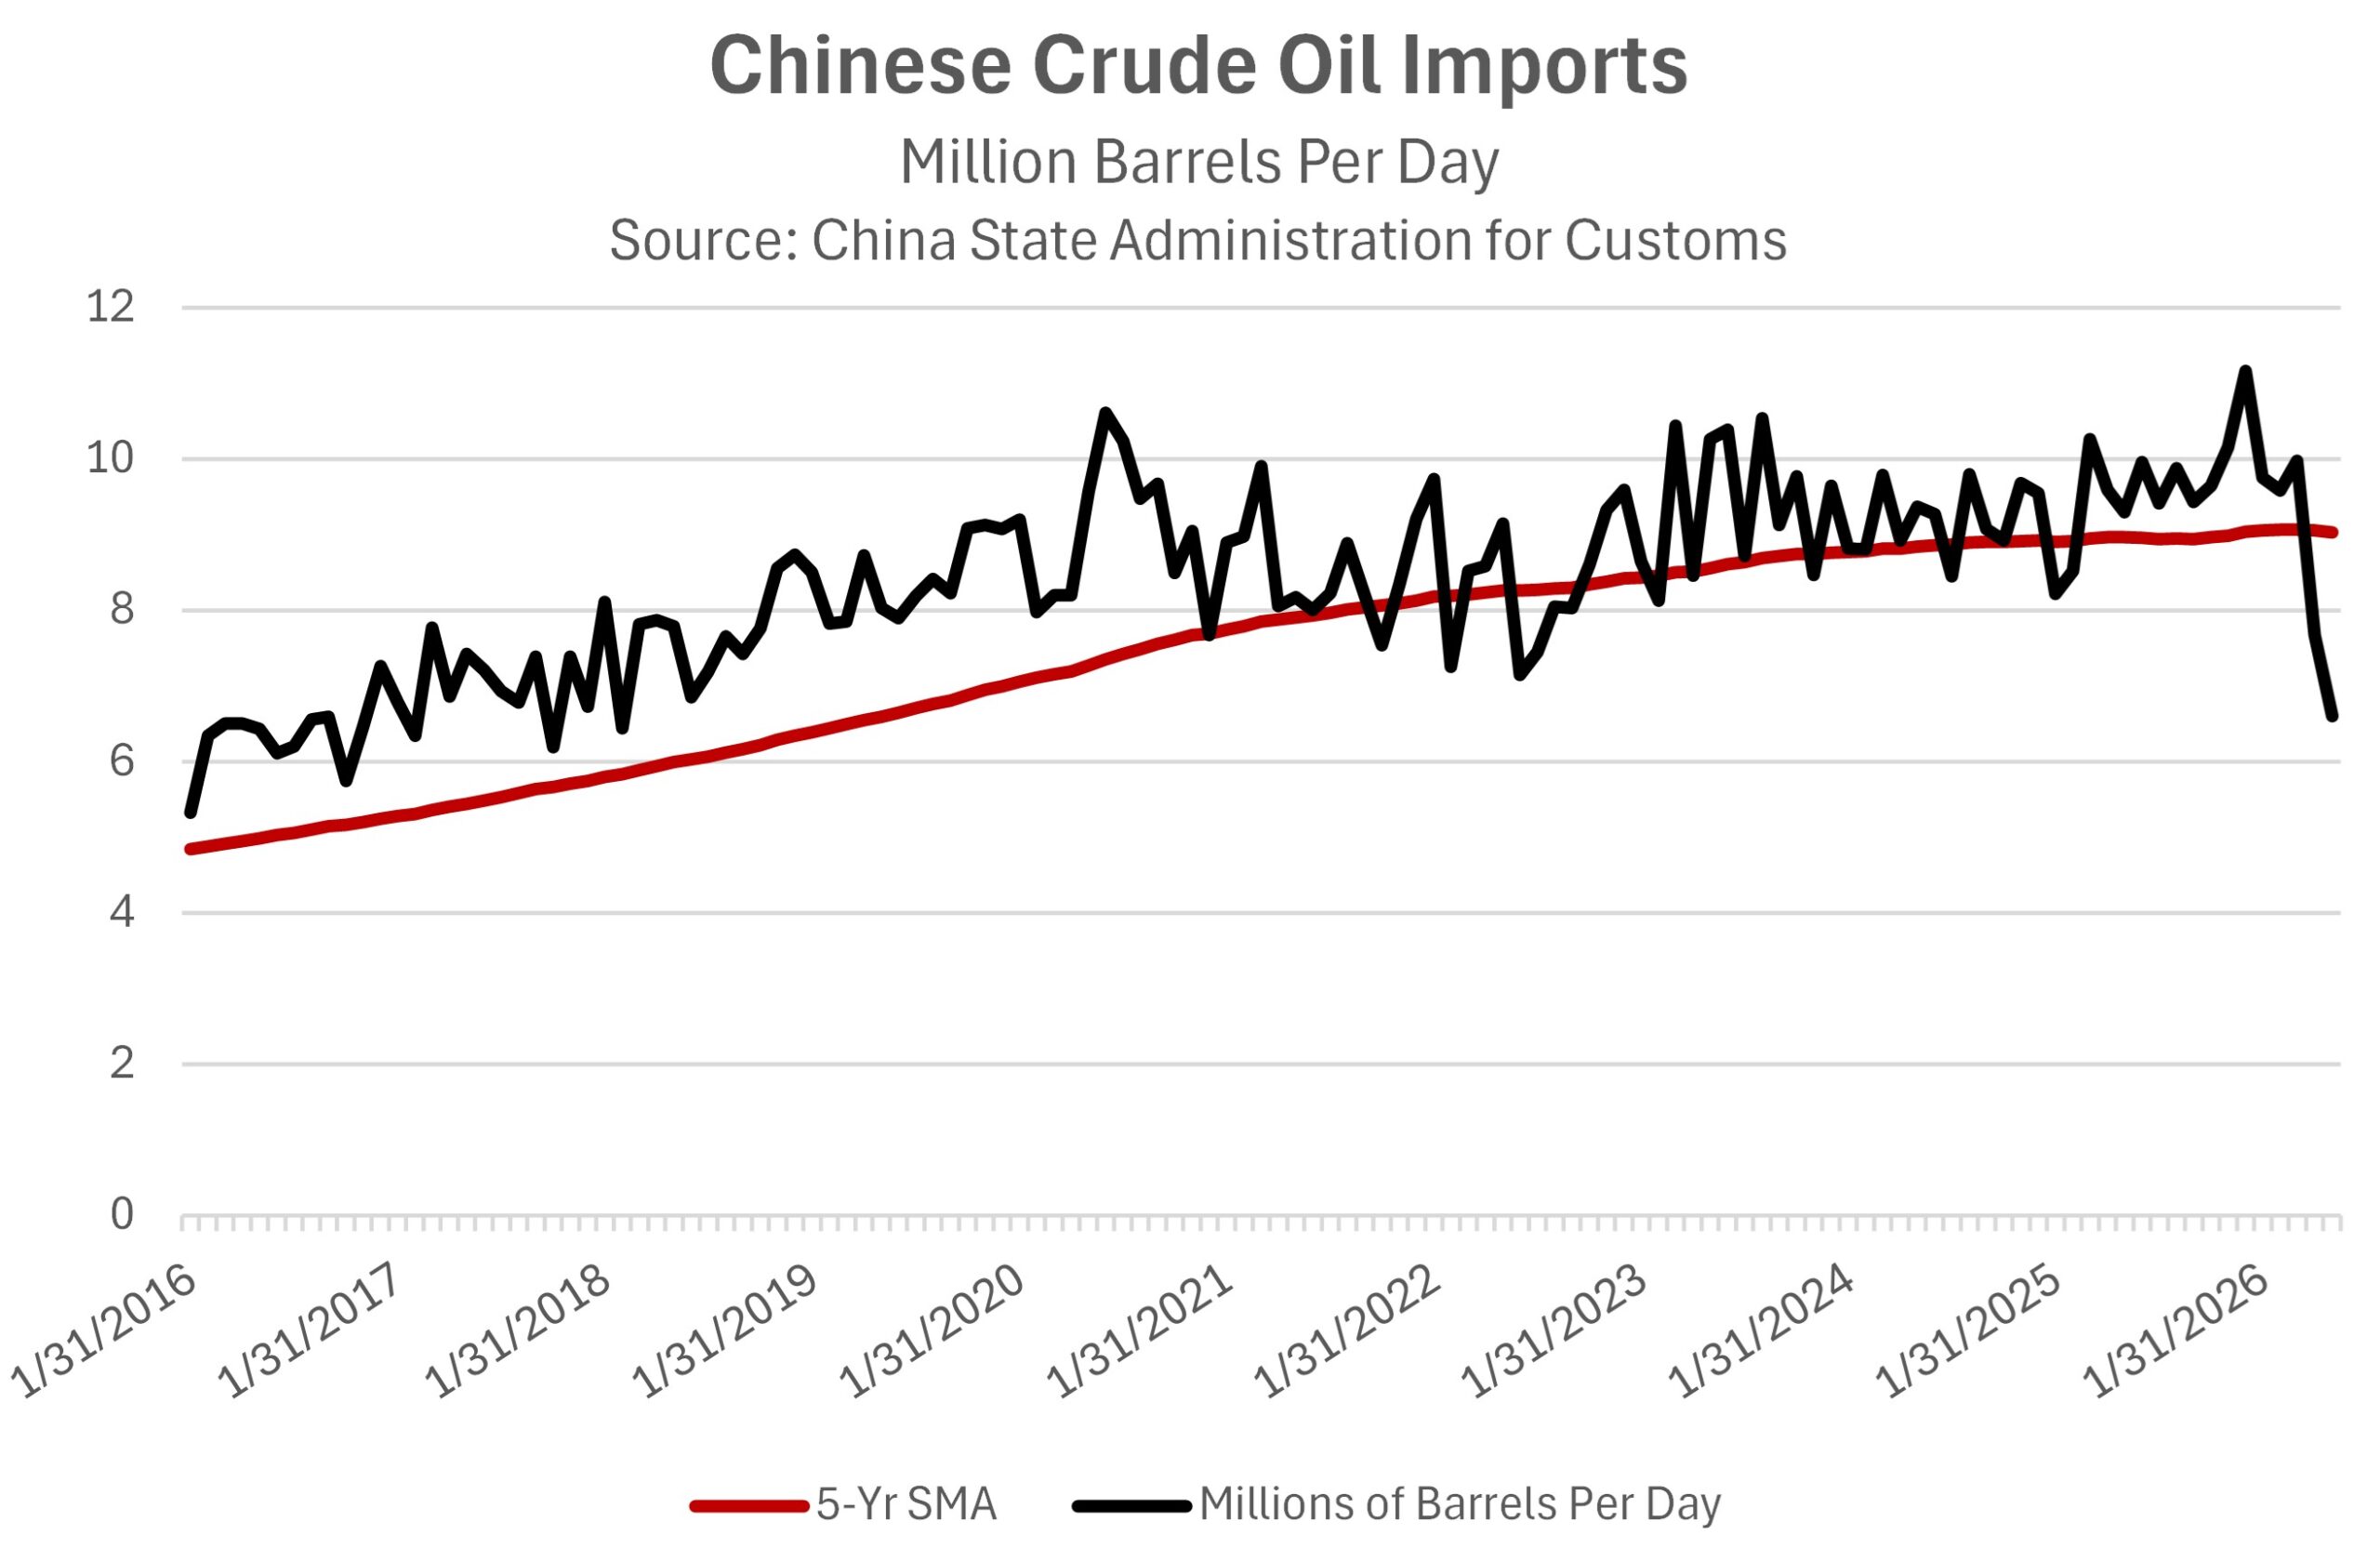
More recent data appears to solve the mystery about why energy prices haven’t risen further and have even fallen back. Recent data shows Chinese oil imports have dropped to approximately 6.6 million barrels per day, down 38% from the average of about 10.6 mbpd in 2025. The drop of about 4.0 mbpd equates to almost 4% of current global oil demand. It could also offset much of the net reduction in global oil shipments through the strait, which analysts estimate to be between 6.0 and 12.0 mbpd.
Chinese energy imports and inventories are notoriously opaque, so these figures are uncertain. Nevertheless, if China really has cut its energy imports as indicated, it would go far toward explaining why energy prices have started to pull back, at least for now. We still believe that a long delay in opening the strait would keep alive the risk of further energy inventory depletion and renewed price spikes. However, China’s apparent disdain for paying elevated prices and its willingness to cut back deliveries is having a salutary impact on global prices and helping calm the world’s financial markets for now.
Going forward, if this trend continues, it will have big implications. For example, China’s ability to forego expensive energy imports helps validate its “all of the above” energy policy, in which it has invested in the full span of possible energy sources, ranging from coal, oil, and natural gas to nuclear, wind, and solar. China is now benefiting from the flexibility it has gained from having such a broad array of energy sources. We also think this situation illustrates how much economic flexibility China has gained from building its enormous strategic reserves of energy and other commodities. Although China won’t reveal the true level of its inventories, outside analysts estimate that they are currently several times bigger than the US’s Strategic Petroleum Reserve. It would be no surprise if governments around the world now take a lesson from China’s approach and try to adopt a similar all-of-the-above energy policy and start rebuilding inventories once the war is over and prices come back down.
For the financial markets, the decline in oil prices wrought by China’s import cuts has probably been a key reason for the recent modest retreat in inflation concerns and in government bond yields. For example, the yield on 10-year Treasury notes fell from about 4.65% in mid-May to about 4.45% at the start of June. We suspect this has encouraged investors to return to the frenzied buying of US large cap technology stocks related to artificial intelligence. It has also arrested investors’ early 2026 rotation toward value stocks. As we noted above, however, the continued war in Iran is likely still depleting energy inventories around the world, including in China. That likely translates into a continued risk of further energy price spikes and rising bond yields in the coming months if the war isn’t resolved.
Don’t miss our accompanying podcasts, available on our website and most podcast platforms: Apple | Spotify
Asset Allocation Bi-Weekly – The Strategic Petroleum Reserve: A Primer (March 30, 2026)
by Bill O’Grady | PDF
On March 11, the International Energy Agency announced a coordinated draw of 400 million barrels from the Strategic Petroleum Reserve (SPR) System maintained by the organization’s member countries. Understanding the reasoning behind this decision requires an examination of the economics of inventory. This analysis will help the reader understand that SPRs are not just protective stockpiles but have a key psychological element as well.
In textbook economics, inventory doesn’t exist. Theory assumes a frictionless world, which means that production and consumption are continuous functions, and production meets consumption instantaneously. Obviously, this condition doesn’t reflect the real world. The classic example is agriculture: production is seasonal, so there are periods when supply is scarce (between harvests) and other periods when supply is abundant (right after the harvest). Inventory smooths out the supply to better meet demand.
Most goods markets have inventory, and many of them have inventory cycles driven either by production or consumption. Analysts usually attempt to determine what is a “normal” inventory for a given time of the year. Once this norm is established, inventory changes can signal the balance of supply and demand in a market. If inventory is below normal, it likely signals a tight market, which would be expected to bring higher prices. Higher prices encourage producers to make more and consumers to consume less, and the opposite is true when inventory is above normal. This pattern suggests that, under normal conditions, we would expect to see an inverse correlation between inventory and price. In general, high inventory levels should be bearish, while low inventory levels should be bullish.
If the correlation between inventory and price is positive, it suggests hoarding. Hoarding occurs when consumers fear that a good will become unavailable. In response, consumers attempt to build their personal inventory by purchasing more than they would usually hold. If markets are functioning normally, hoarding is irrational. Seeing higher prices, producers will boost output, which should provide enough product to ease shortage concerns. However, hoarding doesn’t usually occur in a vacuum. It typically happens in response to an exogenous shock, like a weather event, war, pandemic, etc. The problem with hoarding is that, at the micro level, it’s a perfectly reasonable response that can make the market situation worse at the macro level. Hoarding is a prime example of the “error of composition.”[1]
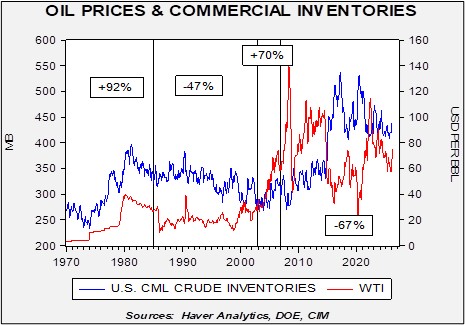
The chart below shows US commercial crude oil inventories and the West Texas Intermediate oil price. We have divided the graph into periods where the correlation between oil prices and inventories flipped. Note that in the 1970s, oil prices and inventories were highly positively correlated, reflecting hoarding. The correlation became positive again from 2003 through 2006 at the end of the China-driven commodity bull market early in this century. The rest of the time, the correlation has been negative, which is what one would expect under normal market conditions.
The thinking behind the creation of SPRs was to reduce the tendency to hoard. If a consumer is worried about physical scarcity (as opposed to high prices), then there is an incentive to stockpile. During the gas lines crisis of the 1970s in the US, it was not uncommon for drivers to wait in line to buy merely a gallon or two of gasoline “just in case.” Strategic reserves serve the purpose of ensuring the availability of supply, which should dampen the desire to hoard.
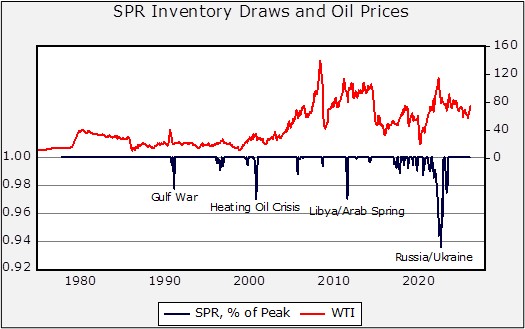
The chart below shows US SPR draws and oil prices. To measure draws, we compare oil prices to the previous month’s peak in the SPR. There are numerous small draws shown as Congress sometimes uses the SPR to fill budget gaps. Often, the SPR oil is “swapped” during supply outages and then usually replaced a month or two later. The major draws, which tend to bring down prices, are noted on the chart.
In our view, the recently announced draw should stabilize oil prices — at 400 million barrels, it’s the largest combined draw in history. However, it’s important to note that the Strait of Hormuz outage amounts to about 20 million barrels per day, meaning this draw could only offset about 20 days of losses. So, we view it as an action that should prevent spikes in oil prices, but it likely won’t be enough to bring down prices sharply without a reopening of the strait.
As our analysis on hoarding shows, if the nations releasing SPR oil keep it within their borders, prices may actually rise. To prevent that, the taxpayers who funded the strategic storage must be willing to “share” with nations that did not. For investors, this is the key factor to monitor. How will we know if the announced SPR release isn’t working? If we see commercial oil inventory and prices rise simultaneously.
[1] A logical fallacy that assumes what is true for an individual is also true for the whole.