by Asset Allocation Committee
We continue to monitor the path of the economy and markets as our expectations for a recession loom. This week we will update our S&P 500 earnings forecast for 2020.
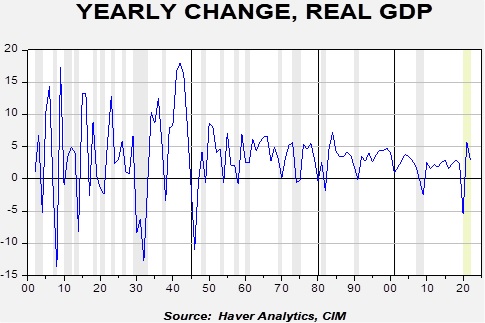
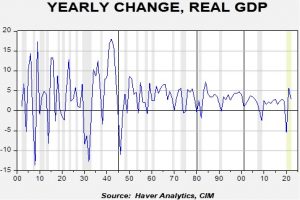
We use two components to build our forecast for S&P per share earnings. First, we need to estimate GDP. Normally, we use the GDP forecast from the Philadelphia FRB’s survey of economists. However, under current circumstances, these forecasts are woefully out of date, so we are left to our own devices. Any GDP forecast at present is mostly a guess; there isn’t enough data for March to project any sort of forecast for Q2. Nevertheless, some estimate of GDP is necessary; our expectation for real GDP is a decline of 5.5% for the year 2020 with a strong rebound in 2021. This will make the 2020 recession one of the deepest on record and the deepest yearly recession since 1946. But, it will be short; our estimate suggests that Q2 and Q3 will be negative, with a positive Q4.
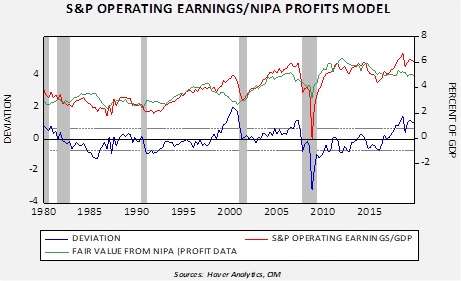
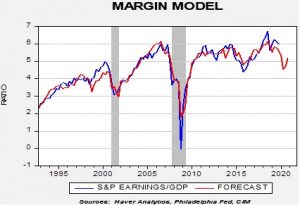
We take this forecast and calculate a nominal GDP number. Second, we use a model to generate the S&P operating earnings margin relative to GDP. It uses a series of variables, including unit labor costs, fed funds, NIPA profits/GDP, the euro, WTI, real net exports/GDP and corporate cash flow. The one variable that has been of particular concern is the comparison of S&P 500 earnings/GDP compared to NIPA profits[1]/GDP; the modeled difference between these two variables has widened and, in the past, has signaled an eventual reversion would bring S&P earnings sharply lower.

The deviation line shows that when S&P earnings/GDP is elevated relative to NIPA profits/GDP, the two tend to correct during recessions. Current levels are elevated; in a recession, history shows the two series tend to converge.
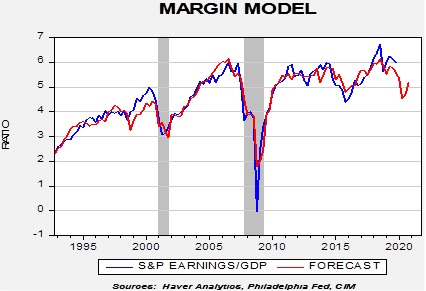
In our 2020 Outlook Update, we postulated that a recession would occur. Our margin model shows that S&P earnings will fall to 4.5% of nominal GDP. That lowers our estimate for 2020 S&P operating earnings to 127.00 per share.
Whenever we make a forecast, we try to determine where the most likely area of error can occur. We note that in the last recession, the model forecast failed to capture the depths of the earnings decline. And, in 2016, it didn’t fully account for the energy-related declines. Thus, we may be underestimating the degree of earnings weakness that may occur. But, for now, we will be using the 127.00 per share number for 2020, with the caveat that further downgrades are possible.
View the PDF
[1] NIPA stands for “National Income and Product Accounts” and is the formal name of the GDP accounts. As part of that accounting, the Commerce Department calculates corporate profits for the entire economy.