by Asset Allocation Committee | PDF
Later this month, the European Union will begin auctioning off bonds to facilitate its economic recovery from the pandemic. In all, the EU plans to raise up to €850 billion over the next 5-7 years, with €750 billion still awaiting approval from the European Parliament. If approved, as we expect, the funds will be backed by the full faith and credit of the European Union members and will come in two parts, the Support to mitigate Unemployment Risks in an Emergency (SURE) program and the Next Generation EU (NGEU) program.
The latter will be aimed disproportionately at supporting the most vulnerable and indebted countries within the union such as Greece, Italy, Portugal, and Spain (GIPS). If successful, this program could provide these countries with a needed boost in consumption and income, something these countries have lacked since the start of the financial crisis.
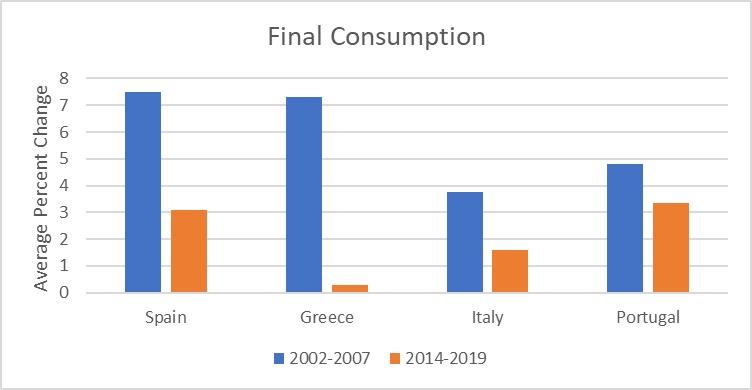
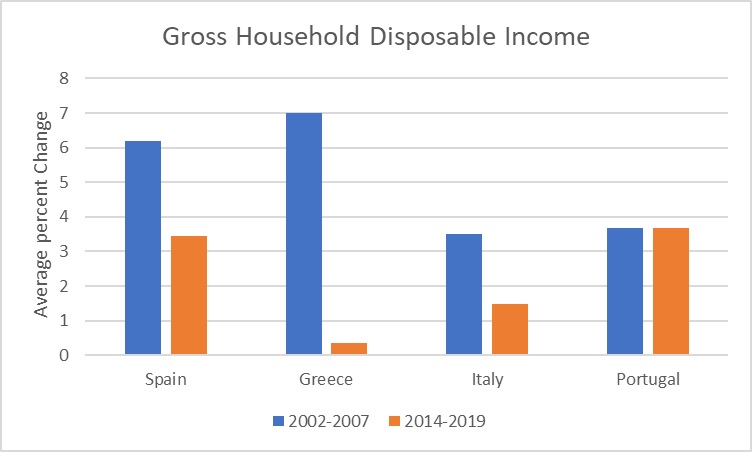
Over the past few years, the GIPS countries were forced to run an export-focused growth model to help repay loans from their respective bailout agreements. This reliance on exports allowed GIPS to boost their internal savings, which made these countries more solvent. However, despite the improvement in internal savings, the removal of labor protections, fiscal protections, and higher taxes in these countries led to deteriorating living conditions and strained public spending. As a result, prior to the pandemic most of these countries were, by design, growing slowly.
In addition, by having an export-focused growth model, GIPS were sensitive to shocks to the global economy. When the pandemic hit, international travel and global trade collapsed. Lockdown and travel restrictions decimated tourism, which provides a significant source of revenue for these countries, and halted production of manufactured goods. Additionally, the drop in world growth has stunted the demand for global exports. Although the world economy has started to recover, it is unclear when global trade and travel will normalize.
With citizens unwilling to undergo additional austerity and GIPS lacking monetary independence, the recovery fund will likely ease some political angst, which has led to increasing populism in Europe. Even before the pandemic, GIPS were struggling to find ways to appease their citizens who have grown tired of constrained growth. In fact, it is possible that if the EU didn’t ease some of its restraints some of these countries would have withdrawn from the EU and the Eurozone. Fears of political unrest that could undermine the integrity of the EU led the richer northern European nations to agree to the bailout package.
This new spending will allow these countries to boost investment in infrastructure projects, healthcare, and digital technology. Additionally, the fund has also set aside money to invest in green technology. Given the lack of consumption over the past few years due to the restrictions of deficit, these countries have been limited in their ability to invest in their respective economies. The €750 billion of funds, of which €390 billion will be used as grants, will likely provide a notable boost in GDP.
The funds are expected to be disbursed in 2021 and in 2022. In the meantime, countries have access to the €100 billion SURE program to help support local businesses and provide unemployment benefits. That being said, assuming the money from the recovery fund is used wisely, we expect the stimulus could make European equities attractive as we believe that years of austerity have led to a lot of pent-up demand in the GIPS countries. As a result, consumer discretionary and real estate could be of some interest.