

Asset Allocation Weekly (December 4, 2020)
by Asset Allocation Committee | PDF
Over the decades, keen observers of the financial markets have developed a number of theories and strategies that serve as useful tools for understanding market dynamics. One of the most famous such tools is the Dow Theory, which explains longer-term market movements based on the writings of Wall Street Journal founder Charles H. Dow up to his death in 1902. Of the many interrelated concepts that make up the Dow Theory, one that we find especially useful is the idea that stock market averages, like a broad market index and an index of transportation-related stocks, must move in a similar way to confirm that a tradeable trend is in place. When they fail to confirm each other, it’s a signal that the trend may be ephemeral or ready to reverse course.
One quick, easy way to check on market-average confirmation is to compare the change in the S&P 500 Index of large cap U.S. stocks versus the change in a narrower indicator index like the Dow Jones Transportation Average (a purist would compare the Dow Jones Industrial Average against the DJTA, but the larger set of holdings in the S&P 500 probably makes it a better proxy for the broad market). Comparing the S&P 500 with the DJTA makes sense because a broad economic revival benefitting companies across most sectors should be associated with improved business conditions for railroads, truckers, airlines, and other firms involved with moving goods and people to facilitate that commerce. When there is an uptrend in the broad economy or the broad market index, but a decline in transportation activity or transport stocks, it would suggest that actual conditions are deteriorating and it may be time to look for a reversal in the stock market. While the change can be tracked over different time periods, a rolling period of three months makes sense to us.
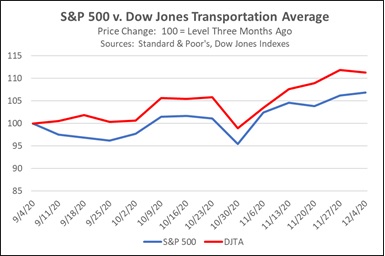
As shown in the chart below, the uptrend in the broad market over the last three months has been nicely confirmed by an uptrend in transportation stocks. The S&P 500 (shown by the blue line) was up approximately 6.9% in the three months to the middle of this week, while the DJTA (shown by the red line) was up 11.3%. There were plenty of fundamental economic and financial reasons for the broad uptrend in stock prices over the period. Through the summer and early fall, coronavirus infections were declining and pandemic economic restrictions were being lifted in most of the country. Despite a resurgence of infections more recently, positive news on the development of safe and effective vaccines has boosted expectations that the pandemic could be overcome relatively soon. In addition, corporate profits have been recovering. All the same, the outsized gain in transportation-related stocks offered a welcome element of confirmation that provided greater confidence in the uptrend.
Another way to see the relationship is to graph the difference between the DJTA and the broad market index, as shown by the blue line in the chart below. The chart indicates that the three-month outperformance of the DJTA versus the S&P 500 peaked in mid-September, early in the period. Since then, the outperformance has gradually moderated, but it has remained positive.

It’s important to remember that market-average confirmation is just one aspect of Dow Theory. Other aspects of the theory, such as secondary confirmation provided by trading volume, are not addressed here. Nevertheless, the DJTA’s outperformance provides a welcome piece of evidence suggesting that the recent uptrend in stocks “has legs.” When added to other, more fundamental indicators, such as the resolution of the U.S. presidential election and continued monetary stimulus from the Federal Reserve, the evidence suggests that equities could continue to appreciate in the months going forward, validating our continued exposure to stocks in our asset allocation strategies.