The Market
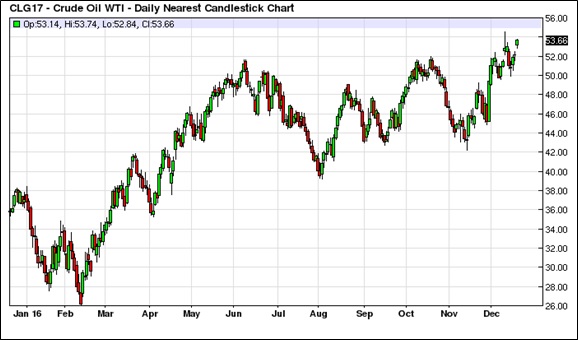
Oil prices have broken above their $44 to $52 per barrel trading range in the wake of the recent OPEC output agreement.
(Source: Barchart.com)
OPEC
In a reversal of recent policy, Saudi Arabia spearheaded an agreement to cut oil production. OPEC has agreed to cut production by about 1.3 mbpd and select non-OPEC producers have chipped in additional reductions of 0.53 mbpd as well. The total OPEC output quota is 32.7 mbpd.
The table below shows the projected cuts relative to what OPEC said it was producing (the reference column) and what Bloomberg estimated for October’s actual production. We have calculated the differences relative to quota from the two production estimates. The areas in yellow represent nations that were not awarded a quota. Indonesia is no longer an oil exporter, while Nigeria and Libya were not given a quota due to persistent production interruptions.
Due to the upcoming holidays, the next edition of this report will be published on January 6, 2017.
The Fed gave us a modest hawkish surprise last week, calling for three rate hikes in 2017 rather than two. The news has boosted Treasury yields and lifted the dollar. Equities mostly absorbed the news without incident.
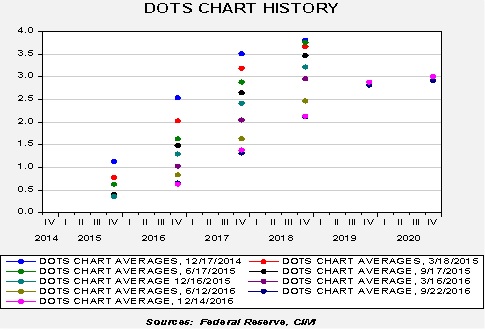
Here is a chart of the FOMC’s average dots over the past two years.
The fuchsia dots represent the most recent meeting. The dots have stopped their steady progression toward lower levels. For better or worse, the path of policy expectations from the dots suggests that the FOMC is becoming comfortable with this path of hikes.
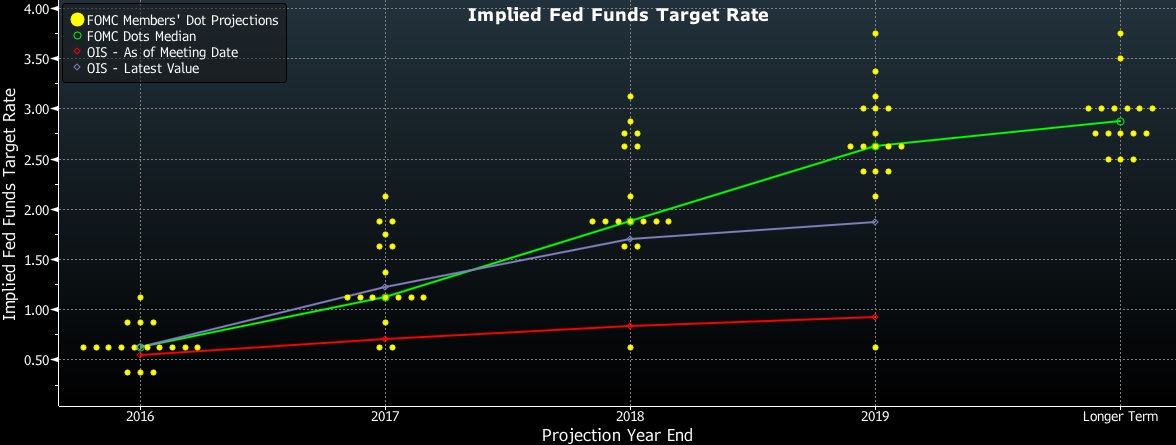
Here is the dots plot from September.
(Source: Bloomberg)
Note the purple line, which is the LIBOR-OIS curve from the meeting day. It has jumped from where it was on the meeting date in September, shown by the red line. For the past few years, the FOMC dots have tended to decline toward the market. The rise in the LIBOR-OIS curve suggests that process is reversing.
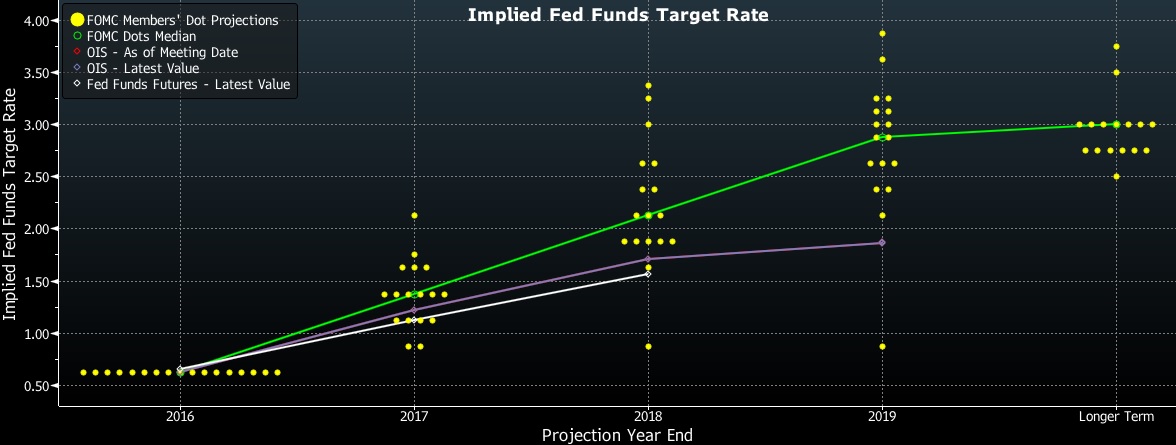
This is the new dots plot, released at the December meeting.
(Source: Bloomberg)
For 2017, the median forecast is currently 1.375%, up from 1.125% in September. For 2018, the median is up to 2.125% from 1.875%. Two participants see no change next year but one of those is probably St. Louis FRB President Bullard, who has decided not to participate in the dots procedure. Although market expectations continue to lag, we did see the LIBOR-OIS rate rise to 1.25% from 0.875% in September.
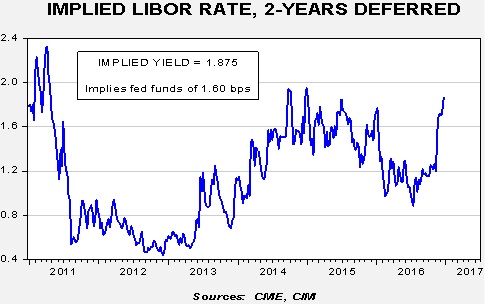
This can be seen in the deferred Eurodollar futures.
The jump in yields since Trump’s election has been striking. We are approaching the highest level of implied rates since the “taper tantrum.” This rise triggered the onset of the dollar rally in mid-2014 and we note that the dollar has been rising since the election.
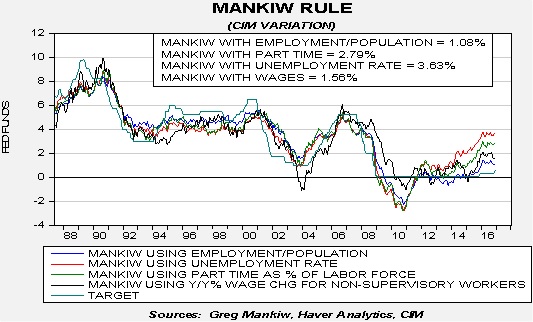
To get some sense of where policy is in relation to the neutral rate, we use the Mankiw rule model, incorporating the recent rate changes by the FOMC. This model attempts to determine the neutral rate for fed funds, which is a rate that is neither accommodative nor stimulative. Mankiw’s model is a variation of the Taylor Rule. The latter measures the neutral rate using core CPI and the difference between GDP and potential GDP, which is an estimate of slack in the economy. Potential GDP cannot be directly observed, only estimated. To overcome this problem, Mankiw used the unemployment rate as a proxy for economic slack. We have created four versions of the rule, one that follows the original construction by using the unemployment rate as a measure of slack, a second that uses the employment/population ratio, a third using involuntary part-time workers as a percentage of the total labor force and a fourth using yearly wage growth for non-supervisory workers.
Using the unemployment rate, the neutral rate is now 3.63%. Using the employment/population ratio, the neutral rate is 1.08%. Using involuntary part-time employment, the neutral rate is 2.79%. And finally, the wage growth model puts the neutral rate at 1.56%.
It is still uncertain which of these variants best reflects slack (or lack thereof) in the economy. Although we tend to think that wage growth or the employment/population ratio is the best measure of slack, the key is which one policymakers view as the most consistent with measuring slack. At this point, we don’t know, although we think the hawks are probably relying on the unemployment rate variant while the chair and most of the doves probably believe the involuntary part-time employment variant is the best measure. The involuntary part-time employment variant is most consistent with six rate hikes over the next 24 months. That path would bring the policy rate near neutral; however, if they are wrong and, for example, the employment/population ratio is actually correct, then policy will be overly restrictive (assuming that ratio doesn’t improve dramatically). Thus, the FOMC is moving rates higher in a slow fashion to allow them time to adjust if it turns out there is more slack (reflected by the lower neutral rate variants) than some data would suggest. Of course, by going slow, assuming the higher neutral rate variants are correct, the Fed could keep policy overly accommodative longer than it should. However, as long as the economy remains globalized and deregulated enough to allow for the nearly unfettered introduction of new technology, being late isn’t all that risky. That assumption would change if the incoming President Trump puts up trade barriers. Thus, the path of monetary policy could be a risk factor in the upcoming year.
(Note to readers: We are suspending the Daily Comment next week, starting on Tuesday, December 27. We will restart the report on Tuesday, January 3. From all of us at Confluence Investment Management, we wish you a warm and blessed holiday season!)
Happy Festivus!
Although market activity is quiet, there were a number of new items of note. First, the lead suspect in the Berlin Christmas terrorist event was shot and killed in Milan this morning. Anis Amri, a Tunisian national that was slated for deportation, is thought to have driven the truck used in the attack. According to reports, Amri was traveling by train from France to Italy when he was approached during an ID check. Amri apparently pulled a gun from his backpack and opened fire on security officers who returned fire and killed him. On the one hand, the fact he was tracked down in less than a week suggests security forces were generally on top of the situation. On the other hand, the fact Amri passed through at least three borders since the attack (Germany, France and Italy) will raise calls for better frontier security. Of course, this would undermine Schengen Area policy which allows for free movement within the EU.
It appears that two hijackers have taken control of a Libyan airliner that was forced to land in Malta this morning. The Afriqiyah Airways plane with 111 passengers (and seven crew members) is on the ground in Malta. The two hijackers have threatened to blow up the aircraft. Latest reports suggest the hijackers have released at least 65 passengers with unconfirmed reports that all 111 are now off the plane. It is unclear what the hijackers want.
Two notable news items emerged from China. First, the lead story in today’s FT reports that Chinese officials are not happy with the appointment of Peter Navarro to a newly created trade policy office. Navarro, a Harvard economist and professor at UC-Irvine, holds positions that are strongly anti-Chinese. One pattern we are seeing from China is that they are reacting quickly to any actions by the president-elect they view as unfriendly. Navarro’s appointment is a win for the populists in the Trump government. Second, General-Secretary Xi hinted today that he is open to growth falling below 6.5%; Xi suggested that slower growth is acceptable as long as employment stays firm (which is, of course, the rub). In general, China can engineer any level of growth it wants as long as it has the capacity to expand its debt. However, with its total debt at 250% of GDP and rising rapidly, Xi may be simply acknowledging that the only way to slow the growth of debt is by reducing GDP growth. If China takes these steps, it will reduce global growth. On the other hand, it will reduce the likelihood of a debt crisis.
(Note to readers: We are suspending the Daily Comment next week, starting on Tuesday, December 27. We will restart the report on Tuesday, January 3. From all of us at Confluence Investment Management, we wish you a warm and blessed holiday season!)
There are reports out of Italy that the government will protect bondholders of the failing bank Monte dei Paschi di Siena (BMDPD, $8.70) after an attempt to raise capital failed. The Italian government has created a €20 bn fund to support the banking system. However, it is unclear how the Italian government can use this money to bail out bondholders and not violate EU banking regulations, which require shareholders and bondholders to be “bailed in” to any bank rescue before public money is deployed. In Italy, bank bonds were often sold to households and marketed as forms of deposit. If these bondholders are bailed in, they will take losses on their bonds; this creates a political crisis, at best, and a bank run, at worst. Given the size of Italy’s economy and its political importance to the Eurozone, we would normally expect the rules to be bent to prevent a political crisis in the EU. However, the Germans will be upset if the rules are ignored and with Merkel facing elections in the autumn of 2017 they may take a hard line on this bailout. Thus, the potential for a political or financial crisis is rising due to this bailout.
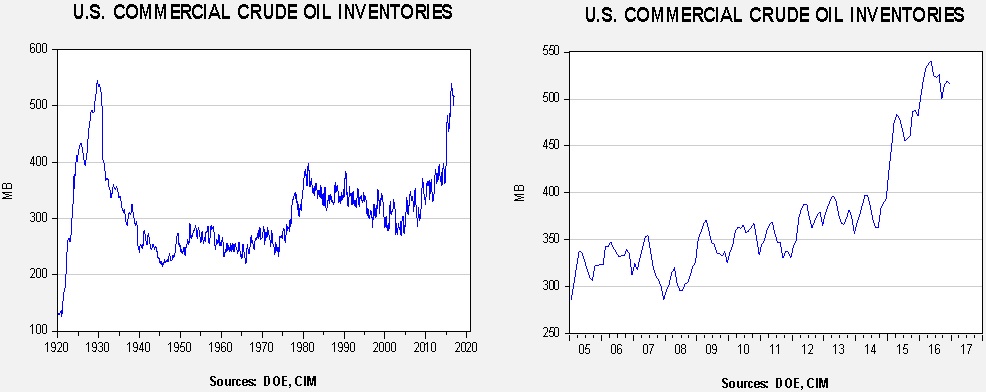
U.S. crude oil inventories rose 2.2 mb compared to market expectations of a 2.5 mb draw.
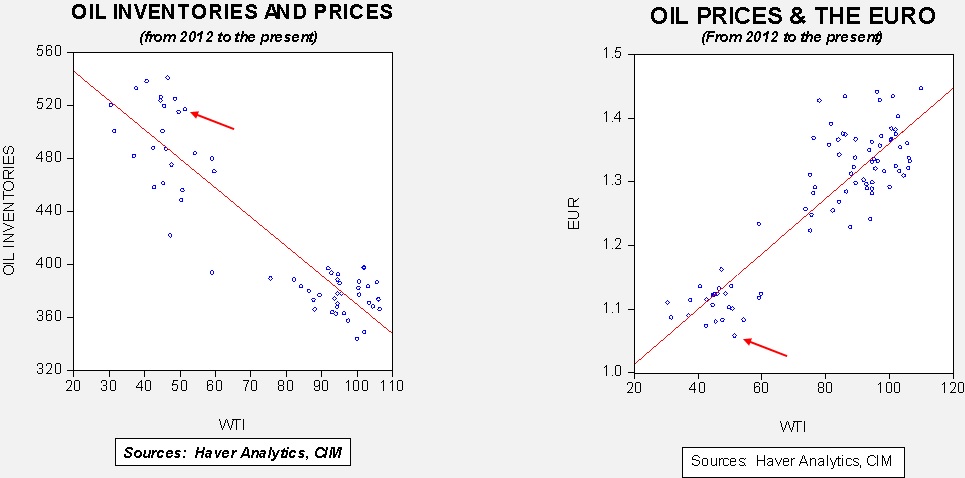
This chart shows current crude oil inventories, both over the long term and the last decade. We have added the estimated level of lease stocks to maintain the consistency of the data. As the chart below shows, inventories remain elevated.
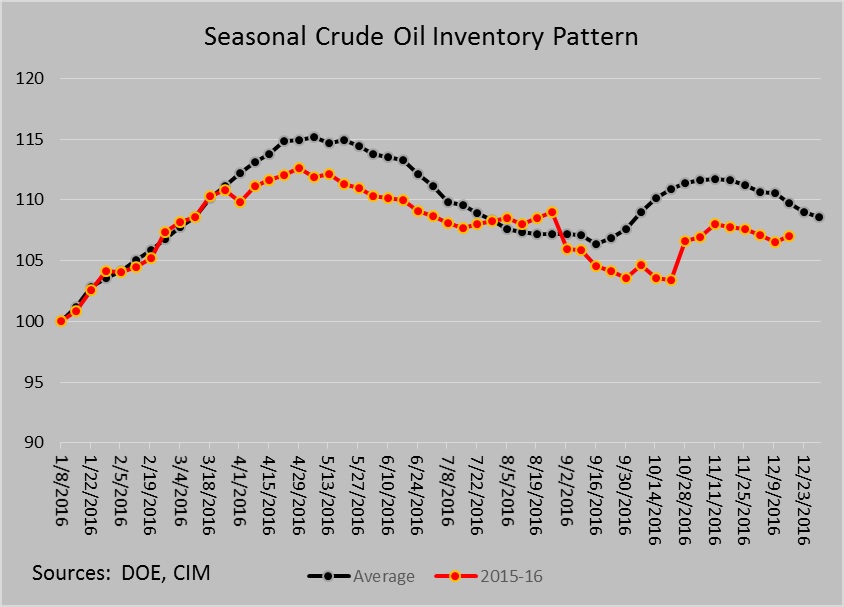
The annual seasonal pattern suggests inventories should decline into year’s end. This week’s data is inconsistent with that relationship. Still, on a seasonal basis, inventories have declined more than usual.
Based on inventories alone, oil prices are overvalued with the fair value price of $40.47. Meanwhile, the EUR/WTI model generates a fair value of $35.82. Together (which is a more sound methodology), fair value is $35.39, meaning that current prices are well above fair value.[1] OPEC has managed to lift prices but maintaining these levels will be a challenge given the dollar’s strength and the continued elevated levels of inventory.
[1] The reason the combined model is calculating a fair value price below the individual models for the euro and oil stocks is due to the fact that the euro and oil stocks are collinear. In other words, the euro and oil stocks are correlated at -88.8%, meaning a weaker euro usually means higher oil stocks. The fact that oil inventories are falling into a weakening euro is unusual.
The economy will avoid a recession in 2017. GDP growth is expected to average 2.8% with core PCE inflation approaching the Federal Reserve’s target of 2.0%.
Fixed income markets will be challenging:
We expect three rate hikes of 25 bps each by the FOMC;
Due to rising inflation expectations, 10-year yields will reach 3%;
A swing toward equality and higher inflation would be expected to narrow credit spreads.
Equity markets should be strong until Q4:
Basis the S&P 500, our base case is for a 9.2% rise in earnings to $119.45;
Our base P/E model is projecting a fair value of 18.4x;
Our forecast for the S&P 500 is 2400 to be achieved sometime in 2017, most likely by Q3;
Earnings should exceed our base forecast because:
We will see a narrowing of the S&P/Thomson Reuters operating earnings spread;
Corporate tax reform should increase earnings.
Multiples should also expand due to:
Improved investor sentiment over Trump’s victory, although this could wane by Q4;
High levels of “sideline” cash.
We continue to favor domestic over foreign stocks;
We have a bias toward value;
We are neutral on capitalization.
Commodity prices will tend to struggle due to dollar strength. Oil prices will average around $55 per barrel due to OPEC’s actions to reduce supply.
The dollar will remain strong. We would expect the EUR/USD rate to approach $1.00.
Note: The structure of this report will be somewhat different from our previous forecasts in that we will present a framework for the economy and markets signaled by the election of Donald Trump. We will first offer a basic outline of what Trump represents and use this framework in our forecasts for next year. There are always risks and unknowns about any new president, but the potential for error is elevated as we believe this election clearly signals a change in direction for the economy and the country. Our 2017 Outlook will be affected by these changes, requiring us to discuss at least our initial estimates of the impact of President-elect Trump.
Market activity is clearly slowing as the year winds down. Depressed market activity this time of year isn’t anything new; because of slow trade and thinning volumes, investors should refrain from reading too much into technical signals this time of year.
Foreign ministers of Iran, Turkey and Russia will meet today to discuss the resolution of the civil war in Syria. The U.S. was purposely excluded from this meeting. All three have differing motives in the region. Russia has used the conflict to bolster its influence in the region and to show it is a globally influential power. Iran wants to solidify the “Shiite Arc” from Tehran to Beirut. Turkey wants to recreate the Ottoman Empire.
In the short term, Russia wants to ensure that Assad remains in power over whatever remains of Syria but wants to avoid being pulled into a quagmire. Turkey wants to ensure that the Kurds don’t expand their influence on its southern border and create a de facto state. Turkey also has no love for Assad and, if he remains the ruler of what remains of Syria, it doesn’t want to see his power expand. Iran wants to bolster Assad but make him solely dependent on Tehran for continued power. Iran also wants to quash any Sunni influence in the region. None of the three necessarily trust each other. Although Putin likely enjoys his turn on the stage in the region, he also has seen how easy it is to be pulled into a never-ending commitment. Most likely, Russia wants to find a way to declare victory and withdraw. This means Iran and Turkey are setting up for a conflict. For now, IS remains the reason the war is being fought. However, once IS falls, Iran and Turkey will have to decide how to manage the region. The likelihood of persistent conflict is rising.
[Posted: 9:30 AM EST] There wasn’t much on the economic front overnight. The BOJ, as expected, left policy unchanged. There had been some rumblings about the Japanese central bank allowing bond yields to rise in line with rates in the U.S. To recount, the BOJ has fixed its 10-year JGB yield at zero and will adjust its balance sheet to maintain that price. This policy was changed earlier this year away from a set level of buying. We see little reason for the BOJ to change policy now; in fact, it now becomes more powerful as U.S. rates rise because it supports a weaker JPY. And, that is what we saw in the aftermath of the meeting.
In the press conference, BOJ Governor Kuroda made it clear that policy will remain in place. He indicated that inflation still remains too low and the current JPY weakness is mostly due “to a strong dollar, not a weak yen.” If the BOJ maintains its current policy, we would expect the JPY to continue to weaken.
There were two geopolitical events yesterday. First, a truck struck pedestrians in a crowded market in Berlin in an apparent terrorist attack. According to reports, the man arrested was a 23-year-old Pakistani refugee who entered Germany at the end of last year. This attack will increase pressure on Chancellor Merkel who has come under heavy criticism for her open refugee policy. The chancellor is a consummate politician; given the growing wave of populism, we would expect her to shift her stance away from refugee support to maintain power. However, if she does make this change, Europe will become closed to Middle Eastern refugees and problems in the latter region will worsen.
The other event was the assassination of Russia’s ambassador to Turkey who was killed by one of his security guards, a Turkish policeman. Peter Zeihan, a geopolitical analyst we follow, made an interesting observation about Russia’s elite. In the U.S., there is a surprisingly wide road to influence. A university education, the right internship, a stint in the military, powerful friends, state and local government, a place in the bureaucracy, business success and connections, etc. can be paths to positions of power. In Russia, there is really only one path to national leadership, which runs through the intelligence agencies. The FSU and GRU are the only real roads to positions of influence. Thus, in the U.S., approximately 2.0 mm people have some degree of influence. More importantly, they become a pool of talent that people in power can tap. That number in Russia, according to Zeihan, may be around 200. Thus, losing a figure like Ambassador Andrei Karlov may be quite a blow. He was multi-lingual and savvy. Before going to Turkey he represented Russia in North Korea. Thus, Karlov was no mere functionary but a rare talent. It is important to note that Karlov managed the 2015 incident when Turkey downed a Russia warplane. Karlov was apparently instrumental in helping Erdogan deescalate the situation and maintain Russian/Turkish relations. If anything, they have improved since the event.
Who Putin puts in Turkey will be important. As IS collapses, Turkey, Iran, the Kurds and Syria will be trying to grab territory and influence in the region. If Russia can’t replace Karlov with someone of equal stature, the potential increases for larger conflicts.
[Posted: 9:30 AM EST] Markets are quiet as we head into the last two weeks of the year, although there is an old faithful tendency for the “Santa Claus Rally,” which usually runs the last five days of the old year and the first two days of the New Year. Still, we expect volumes to thin and trading to slow as we head into the holiday week.
Late last week, China captured a U.S. research drone operating in what appeared to be international waters. Although there were concerns that this event would escalate, according to reports, the Chinese have agreed to return the drone after the U.S. filed an official protest. We view this as China’s way of retaliating against President-elect Trump taking a call from Taiwan’s president. If so, this was a low risk way of getting America’s attention. By taking a drone, there were no human lives at risk and giving the vessel back keeps the situation from escalating. At the same time, we expect China to signal that it will respond to all hostile U.S. actions, a warning to the incoming administration that it will not merely acquiesce to actions it deems unfriendly.
President-elect Trump selected Congressman Mick Mulvaney (R-SC) as head of the Office of Management and Budget (OMB) over the weekend. Mulvaney is a staunch fiscal conservative, a supporter of entitlement reform, which is the opposite of what Mr. Trump’s campaign promised. We have been framing the Trump presidency as Speaker Ryan v. Advisor Bannon. For the most part, the picks so far have favored Ryan, suggesting the GOP establishment is mostly co-opting the incoming president. That doesn’t mean the populist cause is lost but he hasn’t selected cabinet and department heads that support Trump’s platform. Although financial markets will tend to support these establishment figures, we still believe the wave of history is in favor of the populists. If Trump fails to satisfy this group, he may return to being a private citizen in 2020.
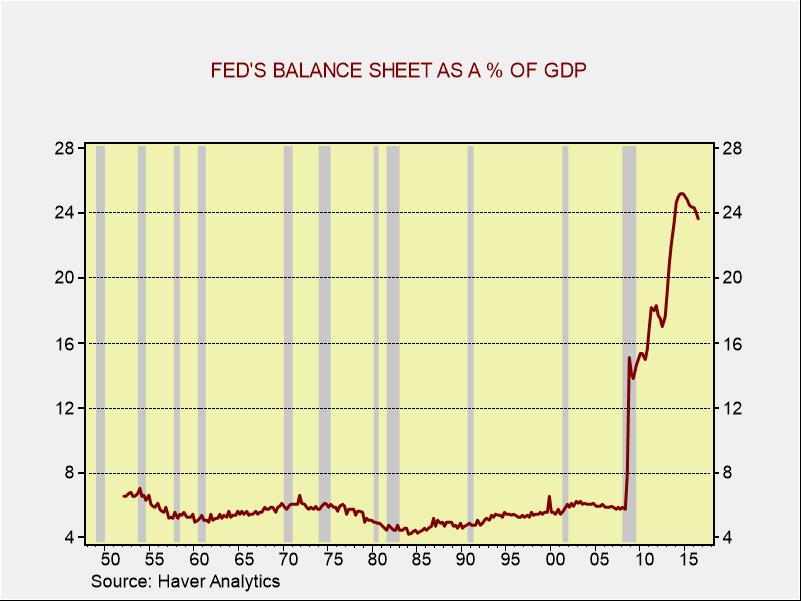
Finally, there are a couple of Fed items worth noting. Chair Yellen is giving a commencement speech today. We would not expect any policy news to emerge from her comments. St. Louis FRB President Bullard, thought to be the low dots on the dots chart, indicated that the Fed should begin the process of shrinking the balance sheet. This is not a dovish act and would be taken as further policy tightening. It is worth noting that the Fed’s balance sheet is already falling relative to the size of the economy.
After peaking at 25.2% of GDP, the balance sheet is now at 23.6% of GDP. If the Fed merely stops reinvesting expiring debt, the balance sheet will steadily shrink; for example, about $44 bn of Treasury holdings alone mature in 90 days or less. We expect the Fed, once it decides to reduce the balance sheet, will shrink it by allowing it to unwind through maturation, not by active sales. If this is the case, the balance sheet would become more weighted in mortgages, which have a longer term maturity profile.
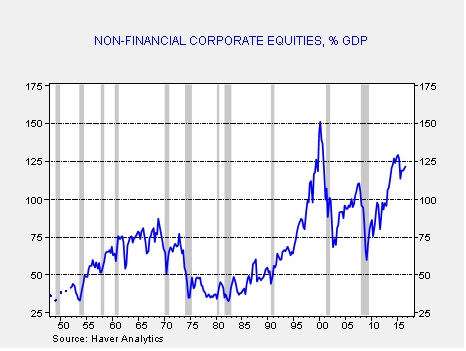
Equity markets are expensive by numerous measures and have become even more extended in the wake of the “Trump Rally.” As noted in our weekly P/E update (found in the last section of the Daily Comment), our four-quarter measure of the P/E is elevated. Another well-known derivation of the “Buffet Indicator” has also reached lofty levels.
This ratio divides the market value of equities outstanding from the Federal Reserve’s Financial Accounts of the U.S. by GDP. Although the ratio is off its recent highs, it is still at the upper end of its historical range.
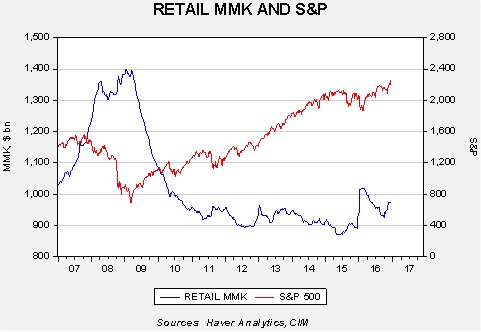
At the same time, the optimism isn’t unfounded. Proposals for corporate tax reform could bring repatriation of the more than $2.0 trillion of corporate cash parked overseas. Tax cuts would boost after-tax earnings. The “E” part of the P/E could rise, making the market less expensive. Another factor to note is that investor cash levels remain elevated.
This chart shows the level of retail money market funds relative to the S&P 500. Since 2011, equities have tended to trend higher when money market fund levels exceed $920 bn. Once money market holdings fall below that level, equities have tended to stall. It appears that investors were building cash in front of the election but, so far, retail investors are not aggressively entering the equity markets. The weekly mutual fund flows suggest that investors are selling out of bonds which probably accounts for the recent rise in money market funds; to date, there isn’t any evidence in the same data that equity mutual fund buying is increasing. This data would suggest that there is ample fuel for further gains in equities.
So, if equities are rich but could work higher, how high is high?
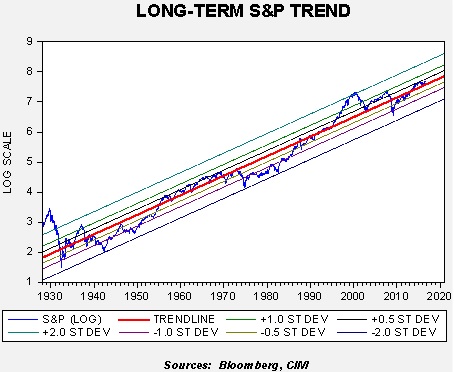
On this chart, we log-transform the weekly close of the S&P 500 starting in 1928. The red line is the long-term trend. We have regressed the trend line against the weekly close and have calculated the standard deviation at the ½ level, one deviation and two deviations from trend. Only twice in the past 88 years has the index exceeded two standard deviations to the upside and it has only touched that level on the downside three times. We are currently below ½ deviation on the upside, suggesting that, on a long-term trend basis, equities are not all that extended.
If we reach +½ standard deviation by mid-2017, the S&P 500 would reach 2480.70; the year-end reading would be 2562.22 by the same measure. By comparison, reading the +one standard deviation line would put the index at 2995.80 by June 2017, and 3094.24 by year’s end. We are not anticipating a rise to +one standard deviation next year but a rise to the +½ level isn’t out of the question.
We still don’t know what the specific policies will be of the incoming Trump administration. Tax policy is complicated and there is always the potential for mistakes. The current euphoria surrounding other policies will probably fade over time. And, although the above analysis suggests that equity markets are sporting high valuations, cash levels are high and current equity levels, while above trend, haven’t reached levels of concern. Thus, for the time being, the path of least resistance for equities is probably higher.
We use cookies to ensure that we give you the best experience on our website. If you continue to use this site we will assume that you are happy with it.