Daily Comment (May 9, 2017)

by Bill O’Grady, Kaisa Stucke, and Thomas Wash

[Posted: 9:30 AM EDT] There isn’t a lot of economic or market news this morning.  Most of the market talk is swirling around the low level of the VIX.  Our contention is that the Fed is actively trying to suppress financial stress; in doing so, the need for insurance against stress, essentially, the VIX, isn’t as necessary.  The problem that arises is that there are periods, such as the Great Financial Crisis, when investors lose faith in the Fed’s ability to contain stress.  In such periods, stress soars and, consequently, so does the VIX.

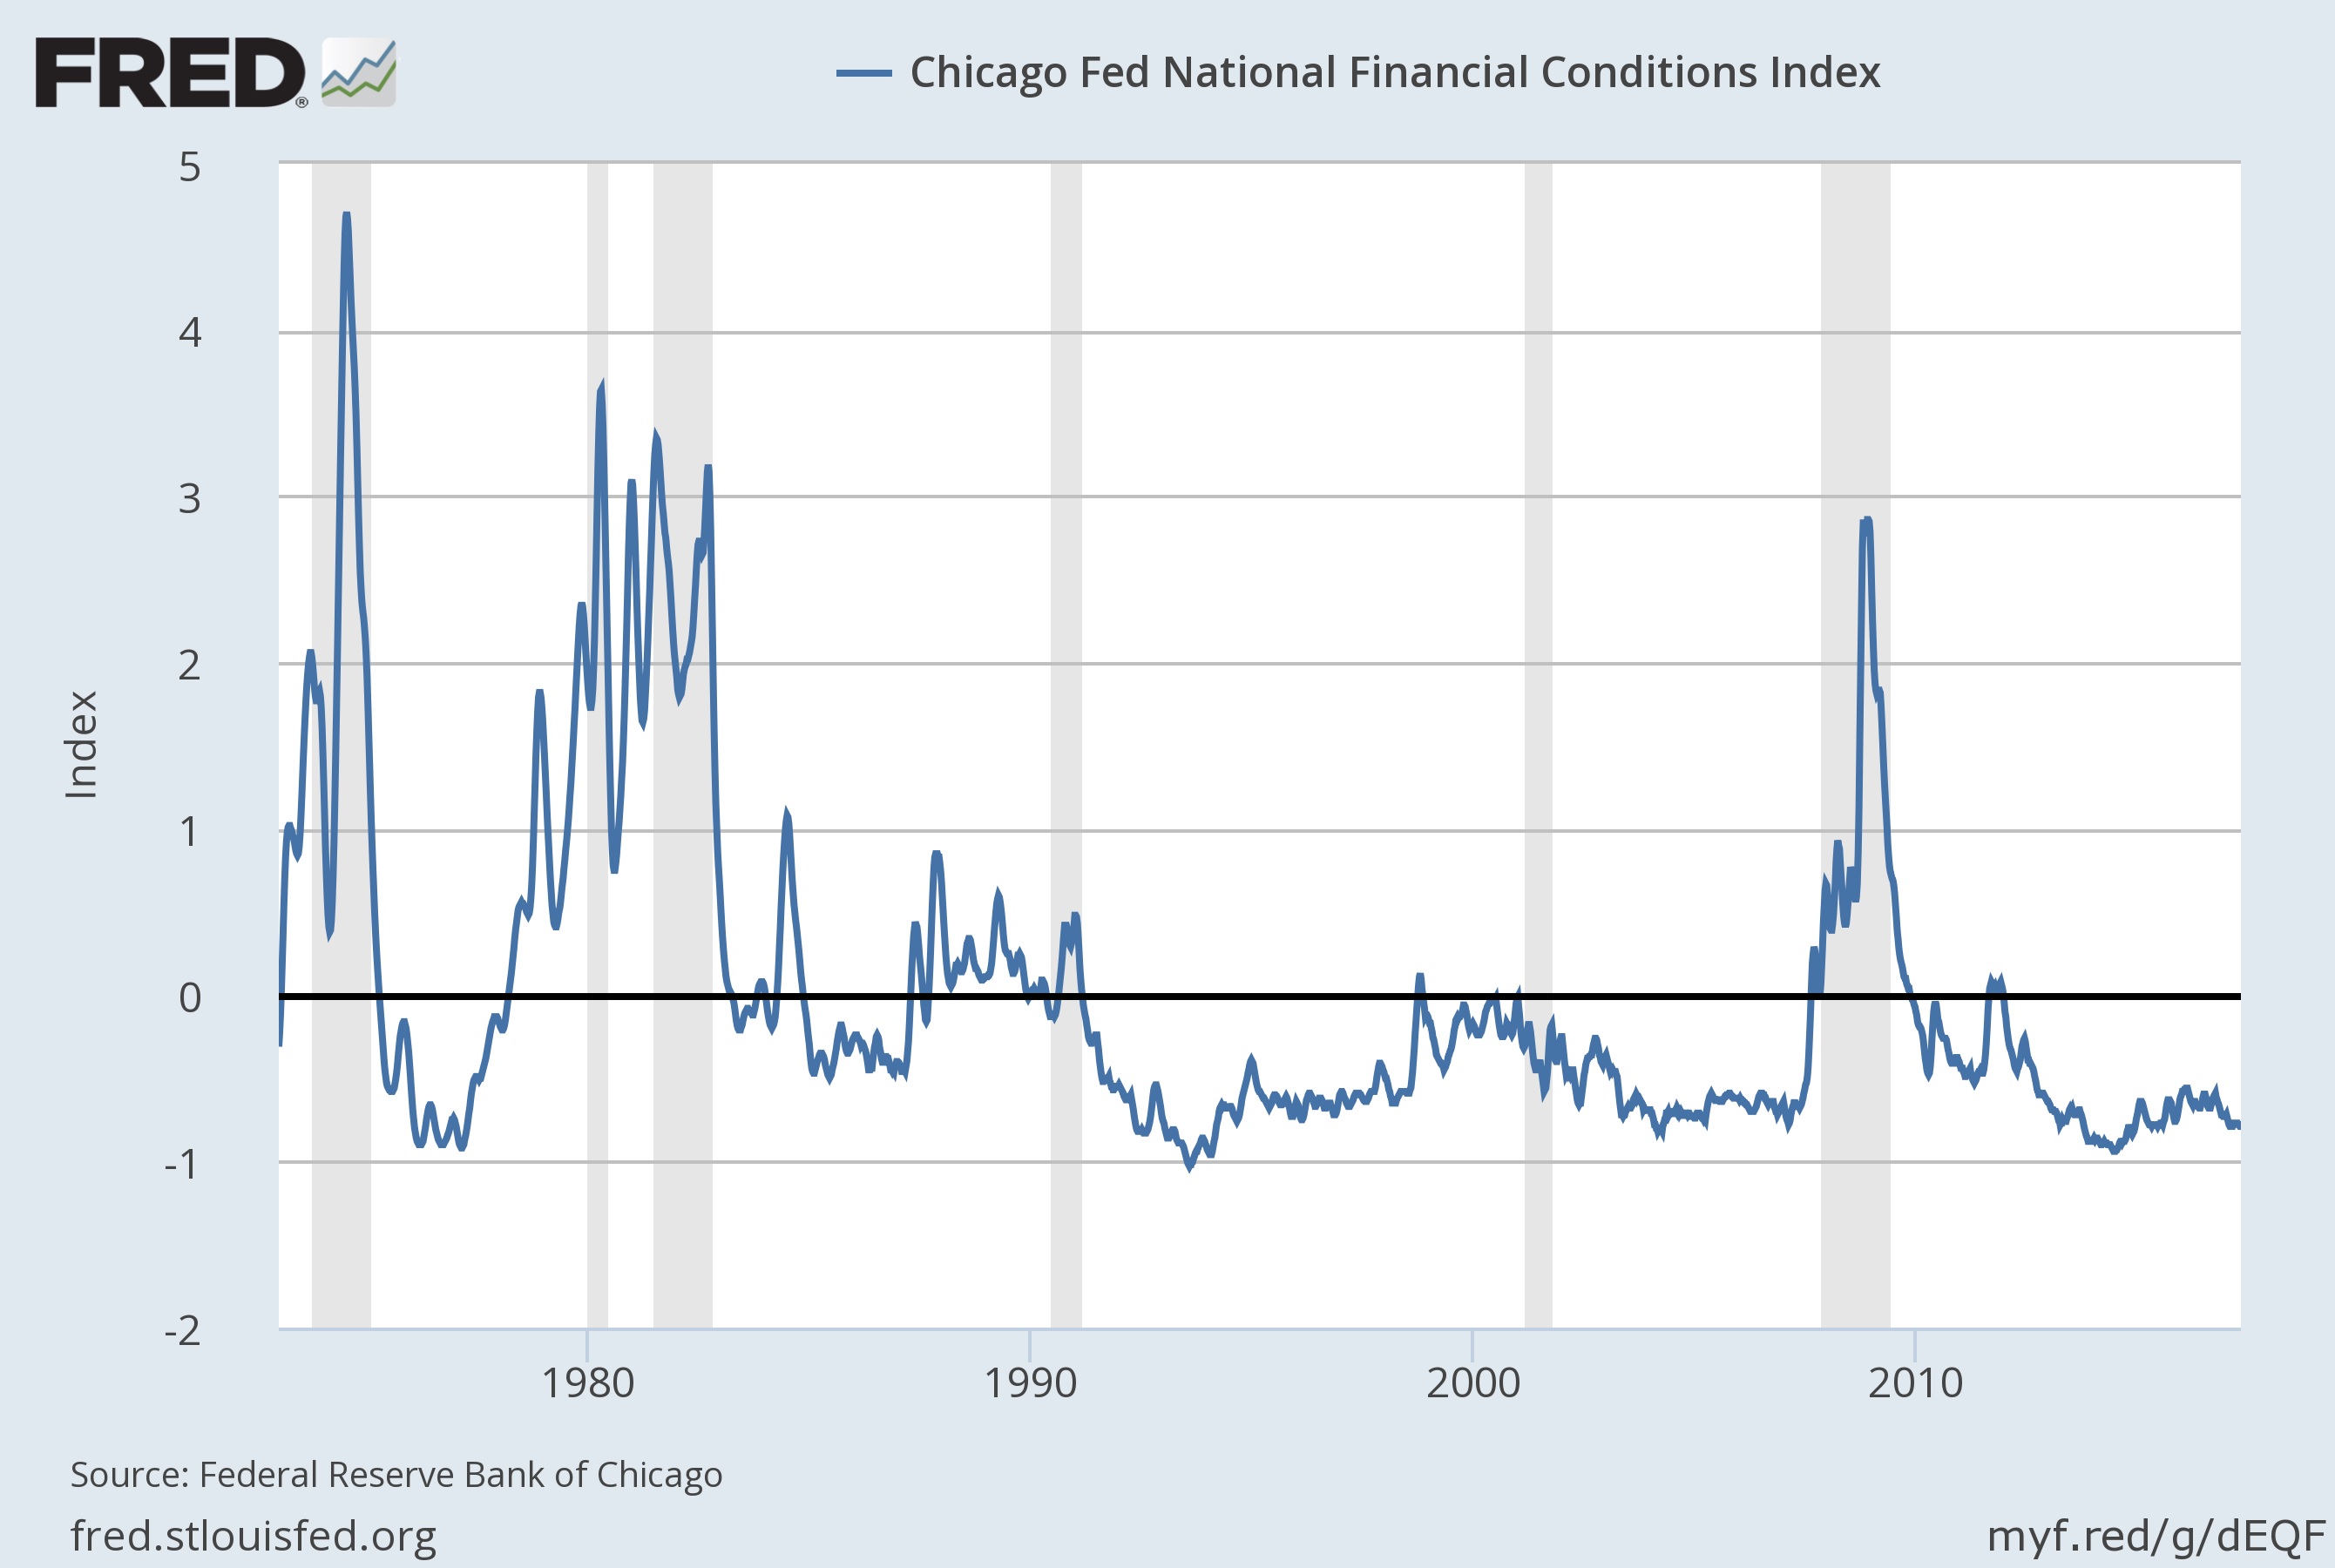
This chart shows the Chicago FRB National Financial Conditions Index, one of the many different stress indices.  It has 105 different variables, including the level of interest rates, spreads, volatility indices for various financial products, precious metals prices, etc.  A reading of zero is normal; any reading under zero suggests low financial stress.  Since the early 1990s, it appears the Fed has actively tried to prevent stress from developing.  The trouble with this policy is that it breeds complacency, encouraging investors to take on increasing risk, confident in the view that the central bank is protecting them from danger.

Part of the problem with the VIX is that it suffers from time decay.  In other words, like most insurance, each day that the insurance isn’t needed the payment for the protection is permanently lost.  Simply recognizing that the VIX is low doesn’t necessarily mean that it should be bought; if conditions remain stable, it will continue to fall.  We view the low VIX as an indication of investor complacency but would argue that, at heart, it’s really a reflection of the conduct of monetary policy.

There are three geopolitical concerns we are monitoring today.

A surge in Afghanistan?  It appears the administration is considering an increase in U.S. military involvement in Afghanistan.  Over the past couple of years, the Taliban has been steadily gaining control of the countryside.  Advisors to the president are putting together a plan to boost U.S. troop presence with the goal of forcing the Taliban to negotiate a settlement.  Currently, it appears that the level of troops is too small to be consequential but large enough to be a target.  However, it’s difficult to see how an increase of a few thousand troops will change the Taliban’s battle plan, which has always been to outlast the U.S.  In fact, this has generally been the battle plan of insurgents in Afghanistan throughout history.  Although we harbor serious doubts that escalation will work, the political danger is that much of the president’s political support came from those who supported a de-escalation of U.S. hegemony.  Escalating in Afghanistan flies in the face of that promise and could prompt a political backlash.

A new president in South Korea.  Exit polls suggest that Moon Jae-in of the Democratic Party will become South Korea’s next president.  He is replacing the disgraced Park Geun-hye, who faces corruption charges.  South Korea tends to oscillate between conservative hardliners and more liberal leaders.  Park was a conservative who conducted a hardline policy with North Korea.  Moon is expected to be more conciliatory with the Kim regime.  History shows that neither stance seems to work all that well with North Korea.  At the same time, the incoming Moon government will face a tricky diplomatic situation with the U.S.  The Trump administration has been very critical of the free trade agreement with South Korea and has threatened the South Koreans with a bill for the THAAD missile defense system the U.S. recently installed on the peninsula.  Thus, the incoming Moon government will likely enjoy a very short honeymoon.

How will Macron govern?  The new French president now faces parliamentary elections on June 11 and 18.  The goal of any French president is to have a majority of seats in the legislature so the government is unified.  However, Macron’s party is new and, at this juncture, has no seats in the legislature.  Although Macron has indicated his new party will have a candidate for every seat, it is difficult to see how he can assemble such a roster unless there are massive defections from the major parties.  So far, that hasn’t occurred.  There is still about a month before the first round of elections are held but the most likely outcome is a divided government where Macron will have to work with a prime minister who isn’t from his party.  If there is disarray in France, the parties of the extreme left and right will tend to gain power.

View the complete PDF

Weekly Geopolitical Report – Reflections on Trade: Part II (May 8, 2017)

by Bill O’Grady

In this multi-part report, we offer several reflections on trade that we hope can provide some insight into how to use macroeconomics to judge the veracity of certain claims.  In Part I, we laid out the basic macroeconomics of trade.  This week, in Part II, we will discuss the impact of exchange rates and examine the two models of economic development, the “Japan Model”[1] and the “American Model.”[2]

The Japan Model of development calls for policies that drive up household saving.  This is usually done through financial repression and wage suppression.  This model is designed to provide cheap investment funds to build up the productive capacity of the country.

In contrast, the American Model of development relies on foreign investment.  In this arrangement, the trade deficit is an import of foreign saving for investment.

As a review from Part I of our report, the following saving identity means that the private investment/savings balance (I-S) plus the public spending balance (Govt-Taxes) is equal to the trade account, M-X (Imports less Exports).

(M – X) = (I – S) + (G – Tx)

If a nation’s saving equals its investment and it runs a balanced fiscal budget, then it will run a balanced trade account.  It doesn’t matter what the exchange rate is or what trade policy is in place; if the private and public sector balances, there will also be balanced trade.

View the full report

___________________________________

[1] We call this the Japan Model because it has been adopted by Asian nations for development.

[2] We call this the American Model because it is how the U.S. acquired saving during its industrial revolution, which began in earnest in 1870.

Daily Comment (May 8, 2017)

by Bill O’Grady, Kaisa Stucke, and Thomas Wash

[Posted: 9:30 AM EDT] Emmanuel Macron won a resounding victory in Sunday’s French presidential elections, winning 66.1% to 33.9%, an even bigger landslide than polls suggested.  Le Pen did do well in the de-industrializing north and in the anti-immigrant south, but she struggled elsewhere.  To win, Le Pen needed the left-wing populists to vote for her; instead, they either voted for Macron or abstained.  In addition, as we have seen in other elections, right-wing populists are never enough of an electorate to win outright.  The candidate must also gather support from establishment right-wingers and Le Pen apparently failed to gather support from the establishment right.  Abstentions were 27% of the ballots, suggesting a rather disappointed electorate.

The next political event will be legislative elections next month.  Current polls suggest Macron’s emerging party will get 24% of the seats, with the center-right attracting 22%.  The National Front is expected to grab 21% of the seats, with the left getting 28%.  The remaining 5% tends to go to fringe parties.  It isn’t clear if Macron can form a majority with his followers and the center-right, so the lack of power in the legislature could hamper his ability to press his deregulation platform into law.

Although the major media is trumpeting Macron’s win as a triumph over populism, we doubt this election will signal the end of the movement.  It is important to remember that Jean-Marie Le Pen lost the 2002 presidential election 82.2% to 17.8% to Jacques Chirac.  So, even though Marine Le Pen was soundly beaten, her numbers improved dramatically in 15 years.  If Le Pen had been able to build a message that attracted the center-right, which is what Trump was able to accomplish, the outcome might have been much different.  On the other hand, the “Nader coalition”[1] of the populist left and right failed to materialize in France and has mostly failed everywhere.  But, that doesn’t mean it could never occur.

Market reaction to the Macron win was anti-climactic.  Given Macron’s lead in the polls, the financial markets had discounted his win by seeing European equities and the EUR rise into the vote.  Consequently, we are seeing long liquidation of positions, leading to a weaker currency and lower equities this morning.

Saudi Arabia and Russia have signaled that the current production cut agreement could be extended into 2018.  Our position is that the Saudis will take the Draghi option (“do whatever it takes”) to prop up oil prices into the Saudi Aramco IPO next year.  The primary beneficiary will be U.S. domestic oil producers who will benefit from higher prices and the ability to gain market share from these overseas producers.

China’s foreign reserves edged higher, up $20.4 bn to $3.029 trillion.  The Chinese government has been successful in cutting outflows from China, bolstering reserve numbers.  Although the trade data (see below) was a bit better than expected, it came mostly from falling imports.  Commodity imports were especially disappointing, with crude import volumes down 15.8%, petroleum products down 3.4%, copper off a whopping 25.1% and iron ore down 13.0%.  The drop in commodity imports is a major negative for commodity-producing nations as it suggests that the Chinese economy may be slowing.  There are growing worries about China’s debt load.  The FT[2] quotes a World Bank study warning that state and local government borrowing is growing despite regulatory efforts to curtail debt growth.  These government entities are using the shadow banking system to lend to special purpose vehicles to expand borrowing and skirt regulatory hurdles.

View the complete PDF

______________________________________

[1] Nader, R. (2014). Unstoppable: The Emerging Left-Right Alliance to Dismantle the Corporate State. New York, NY: Nation Books.

[2] https://www.ft.com/content/799a1afa-3135-11e7-9555-23ef563ecf9a?utm_source=The+Sinocism+China+Newsletter&utm_campaign=7796306811-EMAIL_CAMPAIGN_2017_05_08&utm_medium=email&utm_term=0_171f237867-7796306811-29661833&mc_cid=7796306811&mc_eid=e77499fecc (pay wall)

Asset Allocation Weekly (May 5, 2017)

by Asset Allocation Committee

In our most recent quarterly asset allocation meetings, our analysis determined that emerging markets would not be added to the portfolios.  Since this asset class has been this year’s best performer, some explanation is in order.  One of the primary reasons we have refrained from adding emerging markets is the dollar’s strength.

The blue line on this chart looks at the relative performance of emerging markets to the S&P 500.  When the line is rising, the S&P is outperforming emerging markets.  The red line is the JPM real dollar index.  The two series are positively correlated at 80.8%, meaning that a stronger dollar tends to reflect the S&P 500 outperforming the emerging markets.  This correlation has weakened modestly recently, but is still quite elevated.

The second reason we have been reluctant to add emerging markets is because the relative outperformance is occurring with weaker commodity prices.

Although the correlation isn’t as strong as with the dollar, rising commodity prices tends to coincide with stronger relative emerging market performance.  Although commodities are off their lows, they remain depressed. Thus, the current level of commodity prices seems to support weaker relative emerging market equities.

This chart shows a model of the emerging market/S&P 500 relative performance regressed against the JPM dollar index, the CRB index and fed funds (advanced six months).  Currently, the model is suggesting that emerging market equities are overvalued relative to the S&P against these three independent variables.

Despite this overvaluation, it is possible that the strong relative performance of emerging markets is anticipating a recovery in commodities, a slowing of monetary policy tightening or a weaker dollar.  The dollar lifted on expectations of tighter policy and if the FOMC does not raise rates as much as expected or if foreign central banks reverse their current easy policy stances, then the dollar could weaken.  However, this model suggests that emerging market equities have already discounted that outcome.  Thus, we are concerned that emerging market equities may be ahead of the fundamentals.  If this is true, the current strong performance of emerging markets could stall even with dollar weakness, rising commodities or a stall in Fed tightening.  And, if the dollar rises, commodities fall further or the FOMC raises rates according to the “dots plot,” emerging markets could be quite vulnerable.  For now, we believe the risks exceed the potential return from these levels.

View the PDF

Daily Comment (May 5, 2017)

by Bill O’Grady, Kaisa Stucke, and Thomas Wash

[Posted: 9:30 AM EDT] It’s employment day!  We cover the data in detail below.  The report was mostly strong, although wage growth continues to disappoint.

On Sunday, the French go to the polls for a runoff election between Emmanuel Macron and Marine Le Pen.  The latest polls show Macron leading 62% to 38%.  Although we don’t want to call the election prematurely, a Le Pen win would be an historic outlier.  As we noted last week, the current spread is roughly where Truman/Dewey stood about five weeks before the election.  However, at the time of the election, the spread had narrowed to about 5%.  Truman’s win was still a stunner but the polls were going his way into the election.  Le Pen has not seen any surge in support; in fact, she peaked around 41% last week and has now fallen to 38%.  Overall, she commands about 40% of the electorate and probably won’t improve beyond that.  Thus, we expect Macron to be the next president of France.

We do note that the French president isn’t all that powerful; a good way of thinking about the French system of government is that it is a combination of the American presidential system and the European parliamentary system.  The president does have great authority in foreign policy but domestic policy power really resides with the prime minister who is approved by the legislature.  Normally, the president is the leader of a major party that also controls the legislature.  Thus, the PM is usually seen as an agent of the president.  However, on occasion, the president will represent a different party than the PM, a condition called “co-habitation.”  Such governments tend to be unstable.  The president can dissolve the Assembly and trigger new elections, but this avenue probably isn’t available to Macron if he gets stuck with a legislature he doesn’t like since he has no party.  Parliamentary elections will be held next month and Macron will have a PM thrust upon him, most likely from the center-right, as he has no real party apparatus.  This condition probably means that Macron will be a weak leader and current policies in France will remain in place…and since those policies aren’t all that popular, the likelihood of a continued populist backlash is high.

Yesterday, the House did narrowly pass the AHCA bill.  Although this is being celebrated with great relish by the House leadership and the president, the Senate has already made it abundantly clear that nothing on this is going to happen quickly.  First, Senate leaders are indicating that they will write their own version of the bill and not use the House version as a starting point.  That surely means reconciliation will be almost impossible.  Second, McConnell has indicated he will wait for the CBO to score the bill.  The House moved before the bill was scored, most likely because it feared the CBO would indicate a sharp rise in the uninsured.  Although there are some political analysts suggesting that the House may be in play after this vote, it still seems like a long shot.  Using the Cook Political Report[1] analysis, the categories of “Likely” Republican and “Lean” Republican bring in 234 seats, a 16-seat majority.  Cook did shift 14 seats from Likely to Lean for Republicans after the report,[2] and three into the “Toss-Up” category, suggesting the vote does increase the risk of a turnover in the House.  However, at this juncture, it’s still a long shot for the Democrats to take control.  If the Senate bogs down the process, the potential negative impact of the vote is probably lessened.  Still, for the financial markets, the fact that something was accomplished may boost hopes that tax reform, or at least cuts, could be possible.

Oil prices have come under pressure, dipping under $45 per barrel for WTI on a few occasions overnight.  We view $45 as psychological support, so some consolidation at this level is possible.  As we have been noting for weeks (including yesterday), oil prices have been quite rich relative to oil inventories and the dollar.  Some degree of correction was likely.  On the other hand, the Saudis remain committed to propping up prices so they should be willing to cede market share to other producers, including the U.S.

This chart shows U.S. crude oil exports.  Although the U.S. banned oil exports in 1975, an exception for Canada was made to facilitate smooth refinery operations.  Note the spike in exports seen since the ban on exports was lifted in January 2016.  Rising U.S. oil production and exports pits American producers against OPEC + Russia.  It will be interesting to see how long the cartel will tolerate the loss of market share from U.S. production.

View the complete PDF

___________________________________________

[1] http://cookpolitical.com/house/charts/race-ratings

[2] http://cookpolitical.com/story/10342

Daily Comment (May 4, 2017)

by Bill O’Grady, Kaisa Stucke, and Thomas Wash

[Posted: 9:30 AM EDT] The Federal Reserve did just about what we expected; it did acknowledge Q1 economic weakness but expressed no serious concern about slowdown, suggesting that it isn’t all that concerned about future growth.  We note that fed funds futures are placing the odds of a 25 bps rate hike at the June meeting at 90%, up from the low 81% level before the meeting statement.  As long as economic data remains stable, it looks like a second hike is coming in June.

The House is planning to vote on a replacement bill for the ACA; the vote is expected to be close.  Usually, the leadership of the House won’t bring an important bill to a vote if they are not reasonably confident of the outcome.  If the bill passes, it probably won’t become law in its current form as it is highly unlikely the Senate will pass it without major changes.  However, if it fails to pass the House, it will be a defeat of sorts for the White House and perhaps raise concerns that the president is incapable of shepherding anything through Congress.  That outcome might undermine hopes of infrastructure spending and tax cuts.

SOS Tillerson gave a speech yesterday at the State Department laying out the administration’s vision for foreign policy.  He suggested that the U.S. has been “too accommodating” to emerging nations and allies and “things have gotten out of balance.”  We can see the logic of this statement.  The U.S. has been unusually generous for a hegemon on two fronts.  First, for the most part, we have single-handedly enforced peace in the world’s three “hot zones” of Europe, the Far East and the Middle East by putting troops and bases in these regions.  More importantly, we have taken over the security of Europe and Japan, removing the long-standing tensions that led to two world wars in Europe and the constant tensions between China and Japan.  We essentially did the same thing in the Middle East.  This policy has been quite costly in terms of “blood and treasure,” although we would argue that the costs were worth it since we didn’t fight WWIII.  However, without question, much of the world has enjoyed a “free ride” at the expense of American taxpayers and soldiers.

Second, the other element of hegemony has been to provide the reserve currency, which has led to persistent trade deficits and allowed a model of development designed to boost investment and exports, funded by domestic saving.  This topic is under discussion currently in our four-part Weekly Geopolitical Report series.  By being the global importer of last resort, we have bolstered global growth.  However, the cost to Americans has been a gutting of the middle class that has become clearly evident in the political turmoil observed over the past three elections.

What Tillerson didn’t do was explain how the “rebalancing” is going to occur.  Would it be through a reduction of the trade deficit by forcing foreign firms to source production in the U.S., sort of a “tribute” paid to America for access to the dollar?  Would it be by forcing allies to pay more for their own defense?  If allies pay more, can we still control them?  What if Germany rearms and decides to collect bad Greek debt by taking a few islands?

We can see the need for changes to American hegemonic policy.  However, a clear path isn’t obvious; in fact, it’s fraught with risk.  We are already seeing the results of “thawing” the frozen conflict in the Middle East.  The territorial integrities of both Syria and Iraq are mostly broken and we don’t know what will replace them.  Islamic State was the first attempt; that wasn’t such a great outcome.  An adjustment is necessary.  We believe the policies used since WWII have probably become politically impossible to maintain, but it isn’t known what can effectively replace those policies.  Until they are replaced, uncertainty will remain elevated.

U.S. crude oil inventories fell 0.9 mb compared to market expectations of a 3.3 mb draw.

This chart shows current crude oil inventories, both over the long term and the last decade.  We have added the estimated level of lease stocks to maintain the consistency of the data.  As the chart shows, inventories remain historically high but have started the seasonal withdrawal phase.  We also note that, as part of an Obama-era agreement, there was a 1.5 mb sale of oil out of the Strategic Petroleum Reserve.  This is part of a $375.4 mm sale (or 8.0 mb) done, in part, to pay for modernization of the SPR facilities.  International agreements require that OECD nations hold 90 days’ worth of imports in storage.  Due to falling imports, the current coverage is near 140 days.  Taking that into account, the draw would have been 2.4 mb, roughly in line with expectations.

As the seasonal chart below shows, inventories are near their seasonal peak and should begin falling as rising refinery operations lower stockpiles.  This week’s decline rise puts us further below normal.  Although inventories remain high, this seasonal level is consistent with July, meaning that we may be on the way to an easing of the inventory overhang.  Last year, we saw a 45 mb draw from the April peak.  Assuming a similar drop from this year’s peak of 566.5 mb at the end of March, we will end up at 520 mb by late September.  Assuming a $1.09 EUR and using the model discussed below, fair value is $44.15 for oil prices.  Thus, we would need to see a much larger drop to justify current prices.

(Source: DOE, CIM)

Based on inventories alone, oil prices are overvalued with the fair value price of $31.03.  Meanwhile, the EUR/WTI model generates a fair value of $41.57.  Together (which is a more sound methodology), fair value is $37.68, meaning that current prices are well above fair value.  To a great extent, it appears that the oil market has already discounted a drop in inventory levels and a weaker dollar.

View the complete PDF

Daily Comment (May 3, 2017)

by Bill O’Grady, Kaisa Stucke, and Thomas Wash

[Posted: 9:30 AM EDT] It’s another quiet day in world markets, but the FOMC does conclude its meeting today and is widely expected to make no moves.  The item of interest will be the statement.  We expect it to acknowledge the recent slowdown, but we expect the weakness to be attributed to seasonal factors.  The Fed may not raise rates in June, but they won’t want to remove the possibility in today’s statement.  Although the FOMC did make strong efforts to prepare the financial markets for hikes in 2015 and 2016, the March increase was not signaled at the January meeting so the “teeing up” process may be becoming less of an issue.  Thus, a neutral statement does not necessarily mean that a rate hike won’t occur in June.  The area of greatest uncertainty will be any comments about the balance sheet.  We don’t expect too much to be said here, although we have less confidence in that prediction.  In other words, if there is going to be a surprise stemming from today’s meeting, it will likely come from discussions about normalizing the balance sheet.

Current expectations from fed funds futures put the likelihood of no change today at 87.7%.  The odds of a 25 bps hike in June are at 62.8% and have been rising over the past month.  Meanwhile, Eurodollar futures are still projecting a terminal rate of 1.75% for fed funds, well below the 3.00% projected by the dots plot.

(Source: Bloomberg)

This chart shows the implied three-month LIBOR rate from the Eurodollar futures market.  Based on the normal relationship between the three-month LIBOR rate and fed funds, we can say the futures markets have discounted a fed funds rate at the above forecast level in two years.  It is worth noting how rate projections jumped with the November elections.  If the Trump agenda fails to materialize, we could see this projected rate decline.

Auto sales have eased and are consolidating around the 17.5 mm unit level.

The 17.5 mm unit annualized level seems to be a peak in the data.  By itself, we are not overly concerned about auto sales.  The recovery since the Great Financial Crisis was likely to peak somewhere just above the 17.5 mm unit level and that is exactly what has occurred.  We see no major danger for the economy as long as sales remain above the 15.5 mm level.

However, one issue that does concern us is that automakers may have overestimated further growth as inventories are ballooning.

This chart shows inventory levels divided by sales times the number of selling days in a month.  We are currently exceeding 80 days of car sales on deal lots, well in excess of the long-term average of 61 days.  This inventory overhang is mostly dealt with in two ways; production cuts and price reductions.  The industry loathes to reduce prices because it signals to future buyers that they should wait for “deals.”  On the other hand, temporary plant closures can be costly.  Shutting down production lines and restarting them isn’t frictionless.  However, each summer, the auto industry traditionally slows production to prepare for the upcoming model year.  We would expect the shutdowns this summer to last longer than usual in an attempt to deal with excessive inventories.  We would also not be surprised to see the industry couple the summer shutdowns with more aggressive prices.  Thus, this summer, we could see a jump in initial claims as automakers lay off more workers to adjust inventory levels.  The BLS does attempt to account for this usual increase in claims in its seasonal adjustment process but these adjustments can be overwhelmed if the claims are higher than normal.

View the complete PDF

Daily Comment (May 2, 2017)

by Bill O’Grady, Kaisa Stucke, and Thomas Wash

[Posted: 9:30 AM EDT] May Day is over and markets have reopened.  There wasn’t any market-moving news overnight, although there were some interesting items that provide some background for issues that will concern us in the coming months.  Here is a roundup:

China’s credit slowdown: Yesterday, we noted that China was lifting interest rates.  The rise in rates is part of a pattern we have seen since the Great Financial Crisis.  In this week’s WGR, we began a series on trade and introduced the balance identity, which is that the private investment/savings balance (I-S) plus the government balance (G-Tx) equals the trade balance (X-M).  The formal equation is as follows:

(I-S) + (G-Tx) = (M-X)

China’s development suppresses consumption.  This builds saving which is used to create productive capacity through investment.  Much of the saving went to boosting investment but China ran a trade surplus when I<S, as the above identity would suggest.  After the Great Financial Crisis, global demand wasn’t strong enough to maintain China’s policy structure.  To compensate, China boosted investment further and increased borrowing to pay for it.  We believe China has a serious problem with malinvestment and the cure is to reduce S by boosting consumption.  However, that would require a change in the structure of the economy that would harm the currently rich and powerful in China.  So, in the short term, China is simply recycling the excess saving at home by boosting capacity and likely creating unnecessary investment.[1]  In the longer run, the Asian Infrastructure Investment Bank and the “one belt, one road” expansion plan that Chairman Xi is promoting are likely attempts to create neo-colonial economic conditions in Asia that would allow China’s current development model to continue.  The simple fact is that China can have any growth level it likes as long as it has debt capacity.  The problem with debt capacity is that it is virtually impossible to determine in advance.  In other words, when creditors won’t accept your debt at any price, you have achieved debt capacity.  On occasion, we see Chinese leaders recoil from the rising debt levels and try to curtail borrowing.  This leads to slower growth, which is also unacceptable, and thus borrowing resumes.

(Source: Bloomberg)

This chart shows total social financing as a percentage of GDP; this debt is private sector only (household and corporate).  It is currently 216.4% of GDP.  Although U.S. debt is larger, at 232.5%, the growth rate is far less.  Since 2008, private sector debt/GDP is up 72.8% in China, while U.S. private sector debt/GDP has fallen 20.8% over the same time frame.  For safety, China should curtail its debt growth; however, it has to be willing to accept slower growth, which is clearly unpopular.

The two Trumps: We have argued that the president has two parts of the GOP coalition he needs to address.  The populist faction, represented by Steve Bannon, wants immigration restrictions, trade impediments, job support and regulatory protection.  The establishment wing, represented currently by Gary Cohn,[2] wants traditional GOP goals such as open trade and borders, smaller government and less regulation.  Clearly, the goals of these two groups are not compatible.  The president has been managing these two factions by vacillating policy “balloons” between the two groups.  So, yesterday, the president suggested he might support a large bank breakup proposal, perhaps a return of Glass-Steagall.  This would be something of an anathema to much of the establishment GOP.  He also floated a gasoline tax hike to pay for infrastructure, which might find support among the establishment but is opposed by the populists.  We do think that the president is mostly non-ideological.  He wants to “get things done” and be considered a “winner” and thus he is willing to support different policies to achieve his goals.  It’s unclear how this will work out, but investors should remember that this is a president who doesn’t appear to value consistency.

The Greeks get a deal: Greece’s creditors and the government reached a preliminary deal today that will allow the disbursement of €7.0 bn in funds to Athens.  In return, Greece will make further reforms to its labor and energy markets, along with pension cuts and tax increases.  It isn’t obvious to us that the Tsipras government can survive getting these changes through the Greek parliament.  However, there are vague promises that creditors may consider debt relief if Greece accepts the deal.  The IMF wants to see debt forgiven, arguing that Greece won’t be able to pay back its current burden.  Germany is willing to “extend and pretend” for longer.  We doubt any debt relief comes until after the German elections in September.  The good news for investors is that Greece won’t trigger a Eurozone crisis.

View the complete PDF

________________________________________

[1] This article highlights the issue.  See: https://www.wsj.com/articles/china-looks-to-export-auto-overcapacity-on-slow-growth-world-1493627132.

[2] Although many others could fit this characterization, including Speaker Ryan.

Weekly Geopolitical Report – Reflections on Trade: Part I (May 1, 2017)

by Bill O’Grady

Donald Trump ran on a platform opposing free trade.  Although Congressional support for free trade has been waning for some time, the general consensus among economists is that free trade makes the economy more efficient and supports global stability.

However, the steady erosion of manufacturing jobs in the U.S. and the shrinking of the middle class[1] have called the consensus view into question.  It is clear that President Trump’s anti-trade rhetoric resonated with voters and was one of the factors that led to his election.

Since the election, there have been a number of assertions made about trade, both positive and negative, that appear to us to be only partially true and perhaps designed to support a particular position.  Trade can be negative for participants facing competition from abroad; for the overall economy, it does seem to bring more variety and lower prices.

In this multi-part report, we will offer several reflections on trade that we hope can provide some insight into how to use macroeconomics to judge the veracity of certain claims.  It is our goal to present a fair reading of economic theory that will help readers make sense of what the media reports.  This topic is worthy of a geopolitical report because American trade policy has been a critical element in how the U.S. manages its superpower role.  In Part I, we will lay out the basic macroeconomics of trade.  In Part II, we will discuss the impact of exchange rates and further examine the two models of economic development.  Part III will analyze the reserve currency’s effect on trade.  Part IV will look at some real world examples and conclude with market ramifications.

View the full report

___________________________________

[1] https://www.nytimes.com/2017/04/24/business/economy/middle-class-united-states-europe-pew.html?_r=0