Quarterly Energy Comment (May 10, 2016)

by Bill O’Grady

The Market

Oil prices have rallied since mid-February and are now back into the price range established last autumn.

(Source: Barchart.com)

Oil Prices and Inventories

Inventory levels remain elevated but should begin their seasonal decline later this month.  In fact, working commercial storage hit an all-time high in April, exceeding the levels reached during the Great Depression.  Although there were concerns that prices could plummet once the Department of Energy’s (DOE) estimate of working storage was exceeded, at 502 mb, it has become clear that there was ample storage available.  Thus, worries about a decline into the low $20s per barrel did not occur.

View the complete PDF

Weekly Geopolitical Report – The Geopolitics of Helicopter Money: Part 2 (May 9, 2016)

by Bill O’Grady

Last week, we described in some detail the process of “monetary funded fiscal spending” (MFFS).  Part 1 of this series included a discussion of why MFFS might be implemented, how it would work and the potential problems that come with using it.  In this week’s report, we will examine two historical examples where forms of MFFS were implemented, Japan in the 1930s and the U.S. during WWII.  Next week, we will conclude the final report of the series with market ramifications.

View the full report

Asset Allocation Weekly (May 6, 2016)

by Asset Allocation Committee

In our latest adjustment to the asset allocation portfolios, we added to the REIT positions in three of the four models.  One of the reasons we remain friendly to this asset class has been the steady increase in rental income.


This chart shows rental income from the National Income and Product Accounts (NIPA).  Note that rental income has been rising at a very fast pace since the housing crisis.  In fact, as a percentage of national income, rents are at a postwar high, exceeding 4.25%.


In general, history shows that rising rental income tends to support rising REIT values.

A major reason rental income is rising is due to falling homeownership rates.

The rate of homeownership peaked at 69.3% in Q2 2004 and, in the wake of the housing crisis, suffered a precipitous decline.  Although we have reached a level where we believe stabilization is likely, we doubt this level will rise anytime soon.  And so, rental income should remain elevated until enough new apartments are constructed to depress rents.  So far, that hasn’t happened, although there has been an increase in multi-family construction.  We will continue to closely monitor rental income as a key input into our REIT allocations.

View the PDF

Weekly Geopolitical Report – The Geopolitics of Helicopter Money: Part 1 (May 2, 2016)

by Bill O’Grady

Since the 2008 Financial Crisis, developed economy central banks have been implementing a series of unconventional policy measures, including quantitative easing (QE), zero interest rate policy (ZIRP) and negative interest rate policy (NIRP).  Although these measures likely prevented a deeper financial calamity, such as a repeat of the Great Depression, these actions by the central banks have not led to a strong economic recovery.  In particular, inflation rates have remained very low and growth sluggish.  The lack of growth is partly to blame for the rise of populist movements in the U.S. and Europe.

Economists and other market analysts have pondered whether the central banks have effectively “run out of ammo.”  In terms of conventional and some unconventional policies, the answer is probably yes.  It is hard to imagine how additional QE could boost any of these economies, and the impact of NIRP has, thus far, been mixed.

However, there is one remaining policy tool that is virtually guaranteed to lift inflation and would almost certainly boost growth.  Using monetary policy to directly fund fiscal spending, formally called “monetary funded fiscal spending” (MFFS) and often referred to by its more colloquial name, “helicopter money,” remains within the policymakers’ tool boxes.  However, it is a potentially dangerous policy that is appropriate only in the most extreme circumstances.

This topic has geopolitical importance because of current global integration.  Although nations generally are given some latitude in setting domestic monetary and fiscal policy, MFFS would likely have a significant impact on foreign exchange markets.  If the policy is perceived as a deliberate attempt to weaken one’s currency, it could trigger protectionist policies and bring about a “currency war.”

In Part 1 of this report, we will describe MFFS and barriers to its use.  In Part 2, we will examine two historical examples when forms of it were implemented, Japan during the 1930s and the U.S. during WWII.  In Part 3, we will note some observations from the historical record and look at the likelihood of MFFS being deployed in today’s world, focusing on which nation is most inclined to use it.  As always, we will conclude this series with expected market ramifications from MFFS.

View the full report

Asset Allocation Weekly (April 29, 2016)

by Asset Allocation Committee

We recently completed our quarterly rebalancing process in our asset allocation models.  One of our key assumptions is that the economy will avoid recession but growth will remain sluggish.  Recently, two reliable recession indicators, one from the Philadelphia FRB and the other from the Chicago FRB, have confirmed our expectations.

First, shown below is the Philadelphia FRB’s manufacturing index, which is a survey of manufacturing firms in the Northeast:

This index signals below-trend growth with a reading below zero, and indicates a recession with a reading under -10.  We smooth the data with a six-month moving average.  The current reading is +0.08, suggesting, at best, growth is at trend.  Note that the readings have been rather weak in this recovery.  In fact, the average index value (on a six-month average basis) for this recovery is the second lowest on record, with only the recovery between the 1980 and 1981-82 recessions being slower.

The Chicago FRB National Activity Index, which is a broad-based compilation of national economic indicators, shows a similar pattern.

Similar to the Philadelphia FRB manufacturing index, a reading below zero indicates below-trend growth.  The data clearly shows the economy is weak but not recessionary.

We expect the economy to continue on this path.  Until household debt falls to more manageable levels, consumption will likely remain sluggish which will tend to weigh on the economy.  This forecast for the economy means that:

  1. Inflation should remain low;
  2. The risk in long-duration interest rate instruments is low;
  3. Monetary policy should remain accommodative, even with the Federal Reserve moving on a tightening path;
  4. Equity markets can support a higher than normal P/E.

These expectations have been incorporated into our asset allocation models.  A shift to either recession or faster economic growth would require adjustments but, at this juncture, neither appears likely.  Until a shift in stance occurs, our current allocations will likely remain in place.

View the PDF

Weekly Geopolitical Report – The Impeachment Proceedings of Dilma Rousseff (April 25, 2016)

by Kaisa Stucke, CFA

Brazil’s lower house voted on April 17th to impeach President Dilma Rousseff by a vote of 367 to 137.  The process now moves to the Senate, where the country’s 81 senators are expected to vote sometime in the next few weeks, although a final date has not been set.  For almost a year, Rousseff’s opposition has been trying to impeach her for allegedly manipulating the government budget in 2014.  A simple Senate majority vote to impeach Rousseff could remove her from power, installing her vice president, Michel Temer, as president.

This week we will look at the Brazilian presidential impeachment proceedings and the circumstances that have led to the impeachment.  We will briefly describe the recent political history of the country and look at the specifics of Brazil’s economic development.  As usual, we will conclude with market ramifications.

View the full report

Asset Allocation Weekly (April 22, 2016)

by Asset Allocation Committee

Although it is a widely held assertion that lower gasoline prices will lead to stronger consumption, this correlation has been mostly absent following the most recent decline in fuel prices.  We suspect that household deleveraging has tended to weaken the expected impact of lower gasoline prices.  However, there does appear to be a strong relationship between consumer confidence and gasoline prices.

This chart shows how many gallons of gasoline a person can buy with one hour of non-supervisory average wage.  This ratio not only takes into account the price of gasoline but also the effect of wage growth.  Since 1964, the average worker has been able to buy 8.6 gallons of gasoline for an hour’s wage.  Periods of high oil prices are evident on the chart; the two OPEC oil shocks in the 1970s into the early 1980s and the high oil prices from 2003 to 2014 are obvious.

The relationship between gallons per hourly wage and consumer confidence is fairly clear, although there are some periods where the two diverge.  Generally speaking, two variables, the previously described ratio of wages and gasoline prices, along with the unemployment rate, do a reasonably good job of explaining the trends in consumer confidence.

Consumer confidence isn’t a great predictor of consumption or retail sales.  However, since 1990, it has had a good fit with the trend in price/earnings multiples.

This chart shows the Shiller P/E and consumer confidence.  The two series correlate at the 87% level.  It does seem that rising consumer confidence tends to reflect a degree of investor confidence as well.  Therefore, to the extent that lower gasoline prices and tightening labor markets boost consumer confidence, it is also reflected in multiple expansion, which is supportive for equity markets.

View the PDF

Weekly Geopolitical Report – Nagorno-Karabakh (April 18, 2016)

by Bill O’Grady

In early April, fighting erupted in the region around Nagorno-Karabakh, a disputed area within Azerbaijan but controlled by Armenia.  Reporters described the fighting as the worst since the 1994 ceasefire.  This region is considered one of the world’s “frozen conflicts,” experiencing periodic unrest.

In this report, we will discuss the history and geopolitics of the Caucasus region.  We will examine how the three nations in the area—Georgia, Azerbaijan and Armenia—have evolved, and how the three larger surrounding powers—Iran, Russia and Turkey—affect the region.  Next, we will discuss why this conflict could become a concern for the world, especially the U.S.  As always, we will conclude with market ramifications.

View the full report

Asset Allocation Weekly (April 15, 2016)

by Asset Allocation Committee

It is becoming apparent that the FOMC is using something other than the Phillips Curve to manage monetary policy.  The Phillips Curve postulates that there is a tradeoff between inflation and the labor markets.  Economists have developed models based on the Phillips Curve to determine what interest rate target the FOMC “should” implement.

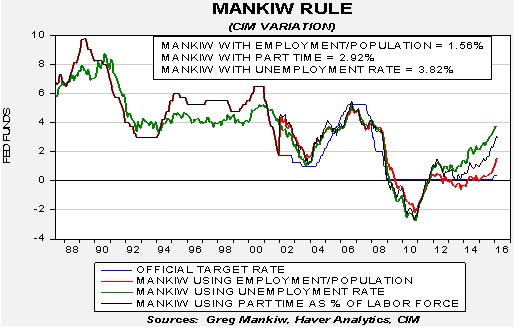
The Mankiw Rule is one of these models that have been developed.  It attempts to determine the neutral rate for fed funds, which is a rate that is neither accommodative nor stimulative.  Mankiw’s model is a variation of the Taylor Rule.  The latter measures the neutral rate using core CPI and the difference between GDP and potential GDP, which is an estimate of slack in the economy.  Potential GDP, however, cannot be directly observed, only estimated.  To overcome this problem with potential GDP, Mankiw used the unemployment rate as a proxy for economic slack.  We have created three versions of the Mankiw rule by using three different variables as measures of slack, one that follows the original construction using the unemployment rate, a second using the employment/population ratio and a third using involuntary part-time workers as a percentage of the total labor force.

Using the unemployment rate, the neutral rate is now up to 3.82%.  Using the employment/population ratio, the neutral rate is 1.56%, and using involuntary part-time employment, the model generates a neutral rate estimate of 2.92%.  In all cases, there is no reason why the FOMC shouldn’t be raising rates now; even the most dovish iteration of the Mankiw Rule, the one using the employment/population ratio, suggests the FOMC is at least 100 bps too easy.

So, if the Fed isn’t using the Phillips Curve, what are policymakers focusing on?  “International developments” are often offered in official documents (minutes and statements) and in press interviews as the reason for caution in raising rates.  In addition, the declines seen in inflation expectations from the TIPS spread have been cited for keeping the target policy rate steady.

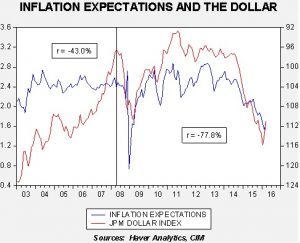
This chart shows the relationship between five-year forward inflation expectations and the JPM dollar index (right scale, inverted).  The data suggest that the FOMC could be keeping rates steady because of dollar strength.  However, since exchange rate policy is outside the purview of the Federal Reserve (that policy mandate is given to the Treasury), the central bank cannot come out and directly say it is guiding the exchange rate lower to change inflation expectations.  Given that the dollar’s rally since 2014 has been mostly due to divergent monetary policy between the U.S. and the rest of the developed world, a less aggressive FOMC will likely lead to a weaker dollar.

Although we cannot know for sure whether our thesis is correct, we would argue that rates should be increasing if the FOMC is using the Phillips Curve as a guide for policy.  It is possible that a dollar index of 104 would put inflation expectations close to 2.4%, which is about the mid-range of values for inflation expectations from 2010 through 2014.  That would generate a €/$ exchange rate of approximately 1.23.  We strongly doubt the ECB would welcome that degree of strength and would probably react by implementing additional stimulus.  Thus, a “race to the bottom” in terms of policy could be the outcome.  In the coming weeks, we will be watching to see if the dollar has replaced the Phillips Curve for guiding policy, or if the majority of FOMC members will pressure Fed Chair Yellen into raising rates.  For now, we expect the path of rate hikes to be slower than the Mankiw Rule would suggest.

View the PDF