Asset Allocation Weekly (April 15, 2016)
by Asset Allocation Committee
It is becoming apparent that the FOMC is using something other than the Phillips Curve to manage monetary policy. The Phillips Curve postulates that there is a tradeoff between inflation and the labor markets. Economists have developed models based on the Phillips Curve to determine what interest rate target the FOMC “should” implement.
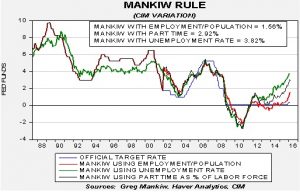
The Mankiw Rule is one of these models that have been developed. It attempts to determine the neutral rate for fed funds, which is a rate that is neither accommodative nor stimulative. Mankiw’s model is a variation of the Taylor Rule. The latter measures the neutral rate using core CPI and the difference between GDP and potential GDP, which is an estimate of slack in the economy. Potential GDP, however, cannot be directly observed, only estimated. To overcome this problem with potential GDP, Mankiw used the unemployment rate as a proxy for economic slack. We have created three versions of the Mankiw rule by using three different variables as measures of slack, one that follows the original construction using the unemployment rate, a second using the employment/population ratio and a third using involuntary part-time workers as a percentage of the total labor force.
Using the unemployment rate, the neutral rate is now up to 3.82%. Using the employment/population ratio, the neutral rate is 1.56%, and using involuntary part-time employment, the model generates a neutral rate estimate of 2.92%. In all cases, there is no reason why the FOMC shouldn’t be raising rates now; even the most dovish iteration of the Mankiw Rule, the one using the employment/population ratio, suggests the FOMC is at least 100 bps too easy.
So, if the Fed isn’t using the Phillips Curve, what are policymakers focusing on? “International developments” are often offered in official documents (minutes and statements) and in press interviews as the reason for caution in raising rates. In addition, the declines seen in inflation expectations from the TIPS spread have been cited for keeping the target policy rate steady.
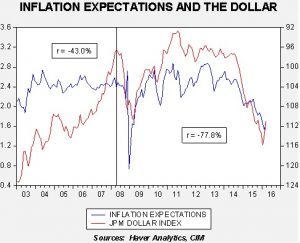
This chart shows the relationship between five-year forward inflation expectations and the JPM dollar index (right scale, inverted). The data suggest that the FOMC could be keeping rates steady because of dollar strength. However, since exchange rate policy is outside the purview of the Federal Reserve (that policy mandate is given to the Treasury), the central bank cannot come out and directly say it is guiding the exchange rate lower to change inflation expectations. Given that the dollar’s rally since 2014 has been mostly due to divergent monetary policy between the U.S. and the rest of the developed world, a less aggressive FOMC will likely lead to a weaker dollar.
Although we cannot know for sure whether our thesis is correct, we would argue that rates should be increasing if the FOMC is using the Phillips Curve as a guide for policy. It is possible that a dollar index of 104 would put inflation expectations close to 2.4%, which is about the mid-range of values for inflation expectations from 2010 through 2014. That would generate a €/$ exchange rate of approximately 1.23. We strongly doubt the ECB would welcome that degree of strength and would probably react by implementing additional stimulus. Thus, a “race to the bottom” in terms of policy could be the outcome. In the coming weeks, we will be watching to see if the dollar has replaced the Phillips Curve for guiding policy, or if the majority of FOMC members will pressure Fed Chair Yellen into raising rates. For now, we expect the path of rate hikes to be slower than the Mankiw Rule would suggest.


