Back to the Future: The Advantages of Dividend Income Over Interest Income (February 2024)

Insights from the Value Equities Investment Committee | PDF

Over the past 15 years, dividend income has often exceeded what could be earned in a money market account. But as seen in the chart below, with the fed funds rate now at 5.5%, the relationship between dividend income and interest income has gone back to what was common before 2008 — where the S&P 500 dividend yield (the blue line) is 2-3% below what could be earned in a money market account invested in U.S. Treasury bills (the red line).

This begs the question:

Why should an income-oriented client still invest in a dividend income-focused stock portfolio yielding 3% when they can now earn 5% in a low-risk money market account?


Higher inflation is causing interest rates to rise on short-term fixed income and money market instruments, and now investors have more choices in generating income returns. While current yields are appealing, we believe it would be short-sighted for long-term investors to abandon the compounding benefits of a growing income stream that can protect purchasing power while also providing for growth of principal.

In this Value Equity Insights report, we highlight some of the potential advantages of growing dividend income through a portfolio of quality, growing businesses — factors which might be underappreciated in the current environment.

Read the full report

Bi-Weekly Geopolitical Report – Thinking About Deterrence (February 12, 2024)

by Patrick Fearon-Hernandez, CFA, and Daniel Ortwerth, CFA | PDF

In his book Leviathan, published in 1651, the English philosopher Thomas Hobbs argued that human society in the state of nature would be marked by conflict and mistrust, as each person would be free to attack his or her neighbor to acquire needed resources. According to Hobbs, government evolved to end this chaotic, violent state by providing security and order to society. Without a powerful central government, Hobbs posited, life would be “solitary, poor, nasty, brutish, and short.”

But what about the community of nations, where each country could be tempted to attack its neighbor for political, economic, or other reasons? No world government has evolved to provide order and security in international relations, even if the UN has been given some powers aimed at helping it keep the peace. As we’ve written before, the more typical source of international security and order has been when a powerful country gained hegemony over much of the globe, as the United States did in the decades after World War II. As US voters now question the costs and benefits of that hegemony, and as the US hesitates to enforce order, rival countries have begun to assert themselves. “The Jungle Grows Back” is the term we use to describe the situation. This report examines how, in this newly chaotic world with weakened hegemonic order, nations may increasingly rely on “deterrence” to protect themselves, with potentially big implications for investors.

Read the full report

Don’t miss our accompanying podcasts, available on our website and most podcast platforms: Apple | Spotify | Google

Asset Allocation Bi-Weekly – U.S. Oil Production at a Record High (February 5, 2024)

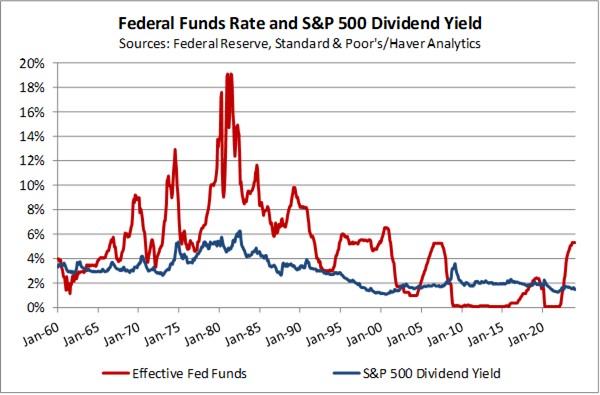
by the Asset Allocation Committee | PDF

These days, because investors have so many different assets to buy in so many different financial markets, it can be easy to miss an important trend or change in trend.  Indeed, that seems to be the case with crude oil, where the long stagnation in U.S. output after the COVID-19 pandemic has suddenly turned into a new surge.  In fact, U.S. oil production has recently reached a new record high.  In this report, we explore what allowed domestic output to start expanding again, what it means for the global economy, and the potential implications for investors.

As shown in the chart below, U.S. field production has fluctuated quite a bit over the last century.  From 1920 to 1970, output grew approximately 4.2% per year, reaching 9.6 million barrels per day (bpd).  However, output then fell and plateaued, despite the incentives to produce during the period’s high prices.  Beginning in about 1985, production began what appeared to be an inexorable decline in the face of public policy and the limits of the available technology.  To many people’s surprise, output suddenly reversed and started growing rapidly again during the Great Financial Crisis of 2008-2009, driven by new technologies such as hydraulic fracturing and horizontal drilling that opened up previously untappable shale formations.  U.S. production jumped at an annual rate of 8.7% from 2009 to 2019, reaching almost 13.0 million bpd.

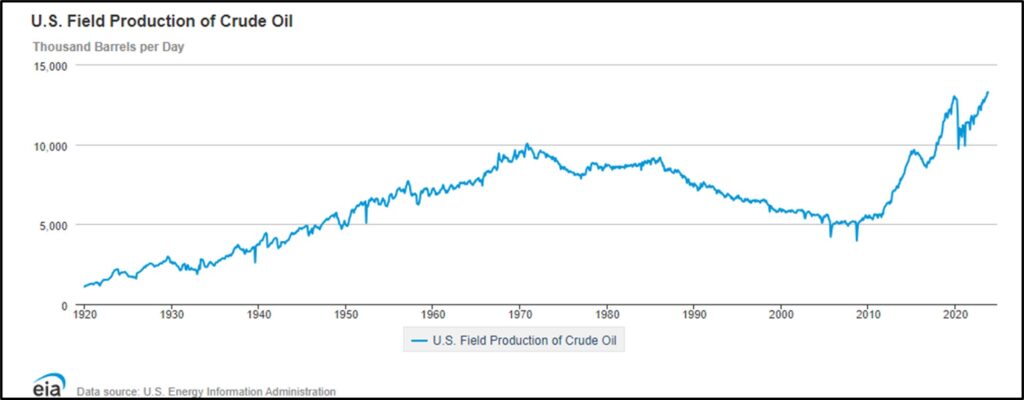
Obviously, the pandemic was a shock to the global economy.  With the collapse in demand, oil prices actually turned negative for a short time in early 2020.  More importantly, U.S. output fell sharply and appeared to stagnate.  Much of the stagnation reflected reduced investment in new exploration and development as investors demanded better capital discipline and a stronger focus on profitability after the many bankruptcies of shale drillers during the period of 2009-2019.  Stronger environmental regulations, which aimed to shift the economy away from fossil fuels, also discouraged drilling.  Many investors began to question whether the industry could ever grow again.

In mid-2023, U.S. oil output began to accelerate in earnest, likely reflecting the incentive of high energy prices at the time and an unexpected second wind from technology improvements.  Press reports say fracking and other shale technologies as well as operating approaches have simply improved more than expected.  In any case, U.S. oil output has now reached 13.3 million bpd.

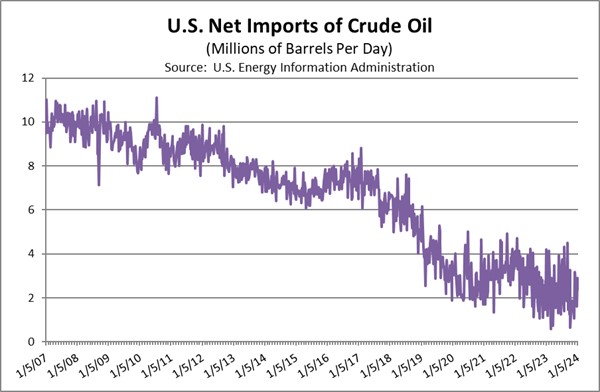
For the global economy, booming U.S. oil output doesn’t just mean that the country has become the world’s largest producer (which it has).  As shown in the chart below, it also means that the U.S. has been able to significantly scale back its imports of foreign oil.

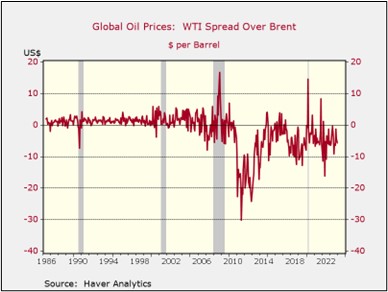
Surging U.S. oil production has altered global pricing dynamics.  For example, before the shale boom, U.S. domestic oil prices (represented by the West Texas Intermediate) were typically slightly higher than foreign prices (represented by Brent Crude).  For the last decade, however, the rich supply of domestic oil has held down U.S. prices.  Reduced U.S. import demand and new laws allowing U.S. oil exports have also improved supplies for other countries.  As shown in the following chart, Brent Crude now tends to trade several dollars higher than WTI.  Nevertheless, the U.S. changes haven’t been enough to totally offset the fact that Saudi Arabia and its partners in OPEC and OPEC+ are withholding supplies in order to boost prices.

Going forward, the unexpected rebound of U.S. oil output and exports signifies that American production could help keep a lid on global prices for an extended period, even as the OPEC+ countries continue to withhold barrels.  What could change the outlook?  One key risk that we’re focused on is the possibility of a geopolitical crisis that disrupts supplies from a major foreign producer or exporter.  If such a crisis occurs outside the Middle East, the availability of excess output capacity in Saudi Arabia and the rest of OPEC+ could potentially fill in the gap.  If the crisis disrupts Middle Eastern supplies, however, the result would likely be a spike in global prices despite the renewed U.S. output boom and excess production capacity in the region.

View PDF

Bi-Weekly Geopolitical Report – Introducing the U.S. Space Force (January 29, 2024)

by Daniel Ortwerth, CFA | PDF

On December 20, 2019, something extremely rare happened in the United States Armed Forces: An entirely new branch of service was born.  For context, the Army, Navy, and Marine Corps were born by acts of the Continental Congress in 1775.  The Coast Guard came into being by act of the first U.S. Congress in 1790, and the relatively young Air Force was born by a similar act of Congress in 1947.  Clearly, these are very rare events, so it was a historic occasion when Congress authorized the establishment of the U.S. Space Force (USSF) as an independent branch of the U.S. Military just four years ago.

We begin this report by discussing the background of the USSF, including how its birth was similar to that of the U.S. Air Force (USAF) and how its relationship with the USAF is similar to the Marine Corps’ relationship with the Navy.  We also discuss why a new service branch was deemed necessary and what it says about the future of space warfare.  As always, we wrap up with a discussion of the implications for investors.

Read the full report

Don’t miss our accompanying podcasts, available on our website and most podcast platforms: Apple | Spotify | Google

Business Cycle Report (January 25, 2024)

by Thomas Wash | PDF

The business cycle has a major impact on financial markets; recessions usually accompany bear markets in equities.  The intention of this report is to keep our readers apprised of the potential for recession, updated on a monthly basis.  Although it isn’t the final word on our views about recession, it is part of our process in signaling the potential for a downturn.

The Confluence Diffusion Index increased from the previous month, suggesting that economic conditions are improving. The December report showed that six out of 11 benchmarks are in contraction territory. Last month, the diffusion index increased from -0.2727 to -0.1515, slightly below the recovery signal of -0.1000.

  • Long duration assets received a boost from dovish Fed talk.
  • Manufacturing production was weak, but demand for goods has ticked up.
  • Jobs data reinforces views that the labor market is resilient.

The chart above shows the Confluence Diffusion Index. It uses a three-month moving average of 11 leading indicators to track the state of the business cycle. The red line signals when the business cycle is headed toward a contraction, while the blue line signals when the business cycle is in recovery. The diffusion index currently provides about six months of lead time for a contraction and five months of lead time for recovery. Continue reading for an in-depth understanding of how the indicators are performing. At the end of the report, the Glossary of Charts describes each chart and its measures. In addition, a chart title listed in red indicates that the index is signaling recession.

Read the full report