by Bill O’Grady
The Market
Oil prices peaked in March around $55 per barrel. There have been a series of lower highs and lower lows, as shown by the lines on the chart.
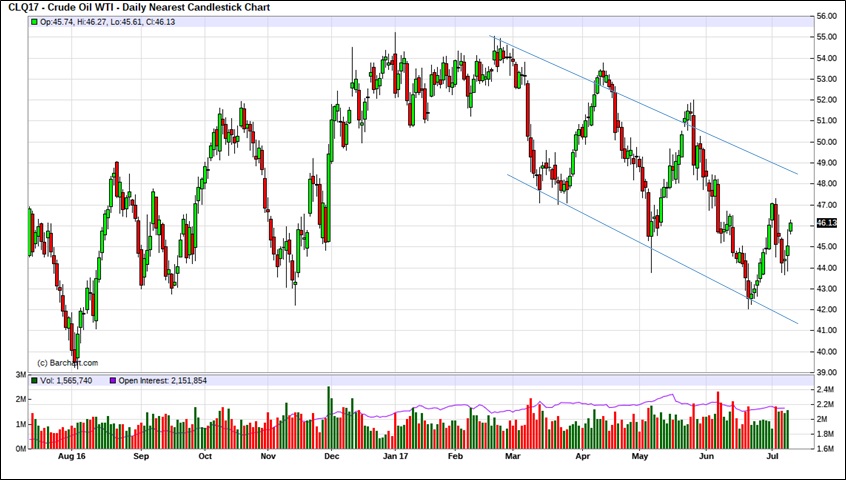
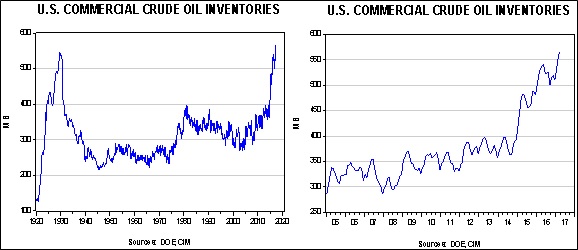
This obvious downtrend has led to a general bearish tone to the market. We don’t necessarily share that level of pessimism; as we will show below, dollar weakness and falling inventories are supportive for oil prices. On the other hand, there are legitimate concerns that Saudis may reverse production restrictions after next year’s initial public offering for Saudi Aramco.