

by Bill O’Grady, Kaisa Stucke, and Thomas Wash
[Posted: 9:30 AM EDT] The euphoria surrounding the election of President Trump appears to be waning. Although the sentiment polls remain elevated, we note the fixed income markets are clearly showing some jitters.
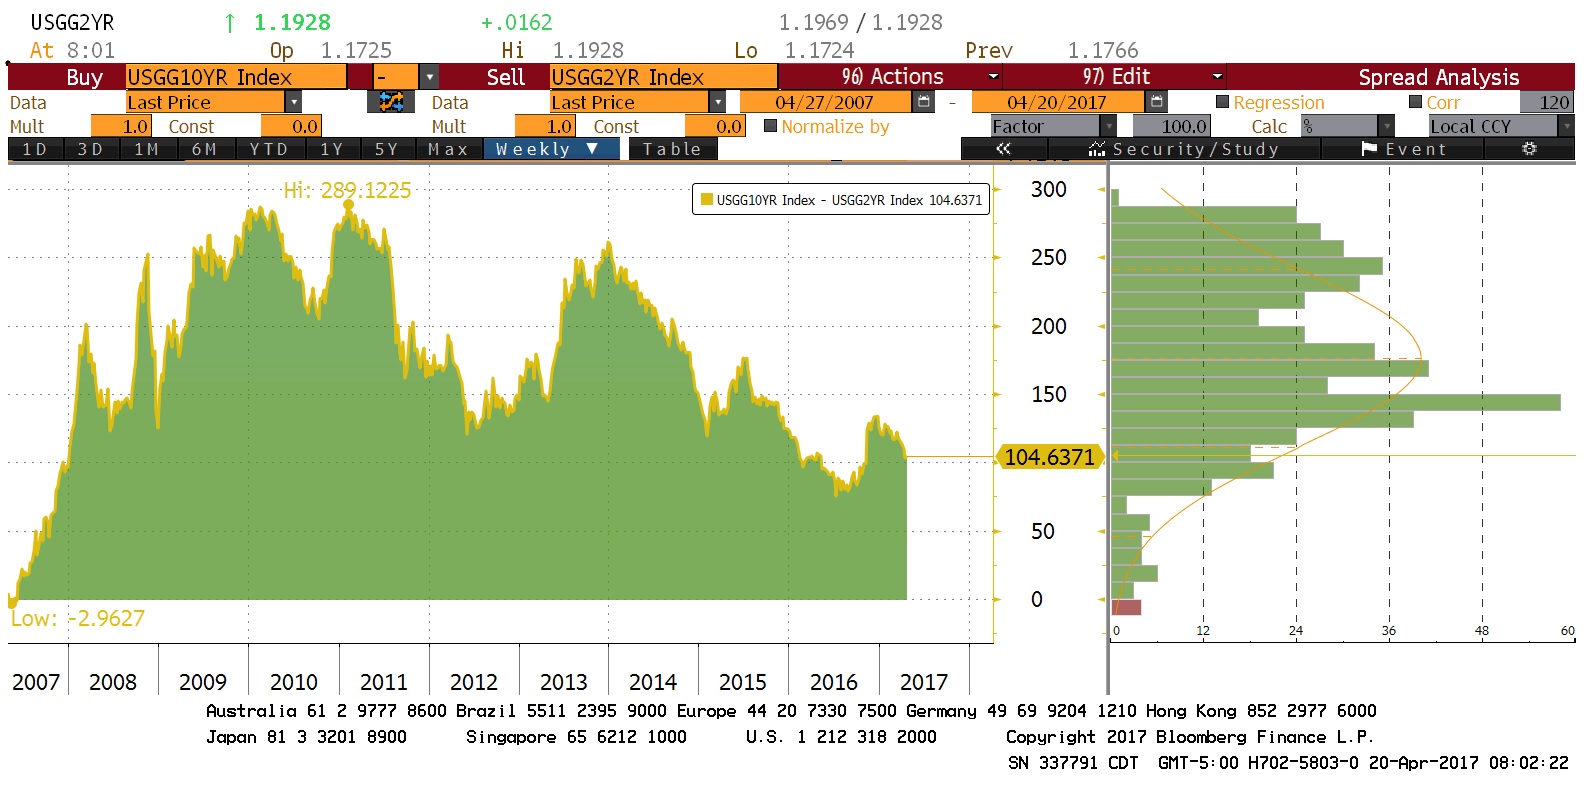
This chart shows the two-year/10-year Treasury spread. Although the curve is steeper than it was prior to the election, it has been flattening rather rapidly recently. If this isn’t arrested soon, worries over the economy will increase and likely weigh on risk assets.
There were massive protests in Venezuela yesterday as those opposed to President Maduro braved security officials and the irregular Maduro forces armed by the president to call for elections and democratic reforms. At least seven people died. More rallies are expected today. Oil production appears to be down to 2.0 mbpd; the country was traditionally a 3.0 mbpd producer. Unrest there is a minor, but supportive factor, for crude oil prices.
U.S. crude oil inventories fell 1.0 mb compared to market expectations of a 1.7 mb draw.
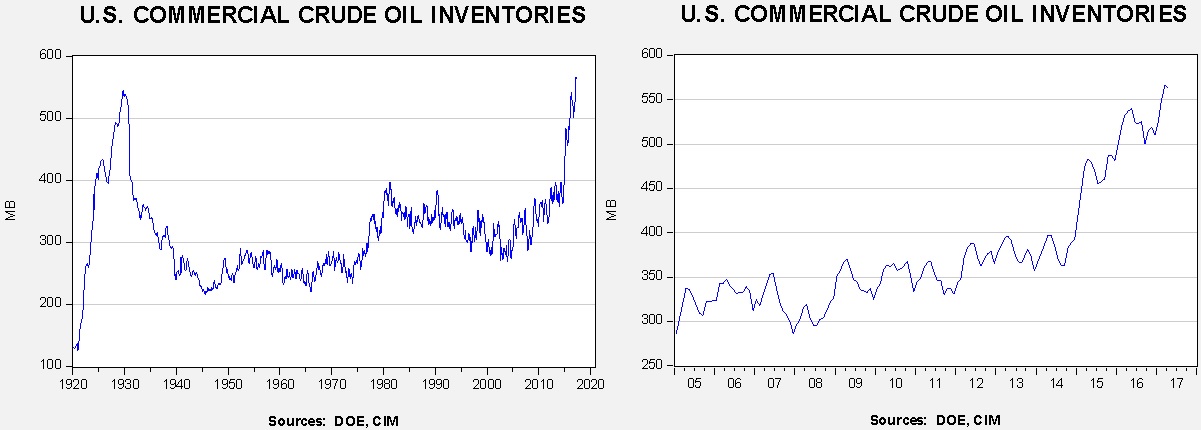
This chart shows current crude oil inventories, both over the long term and the last decade. We have added the estimated level of lease stocks to maintain the consistency of the data. As the chart shows, inventories remain historically high.
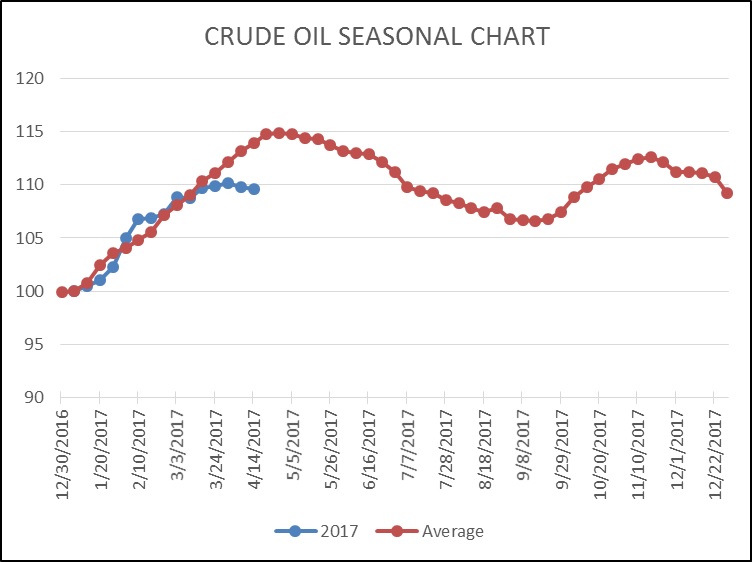
As the seasonal chart below shows, inventories are near their seasonal peak and should begin falling as rising refinery operations lower stockpiles. This week’s decline puts us further below normal. Although inventories remain high, this seasonal level is consistent with July, meaning that we may be on the way to an easing of the inventory overhang.
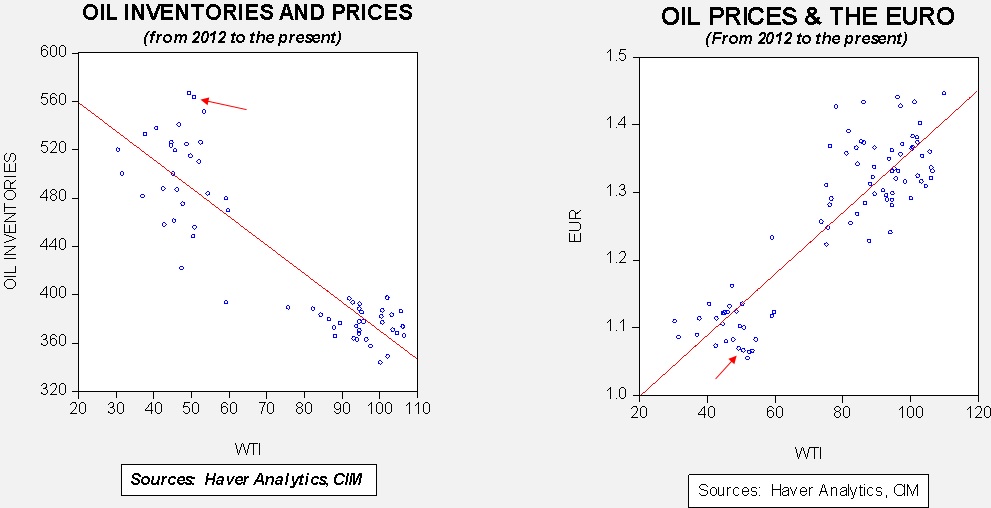
Based on inventories alone, oil prices are overvalued with the fair value price of $29.65. Meanwhile, the EUR/WTI model generates a fair value of $40.35. Together (which is a more sound methodology), fair value is $36.43, meaning that current prices are well above fair value.
Yesterday, oil prices fell sharply, with the rise in gasoline inventories cited as the catalyst. Although gasoline inventories usually decline from their February peaks, the pace of the decline is reaching its nadir and stockpiles normally stabilize through the summer.
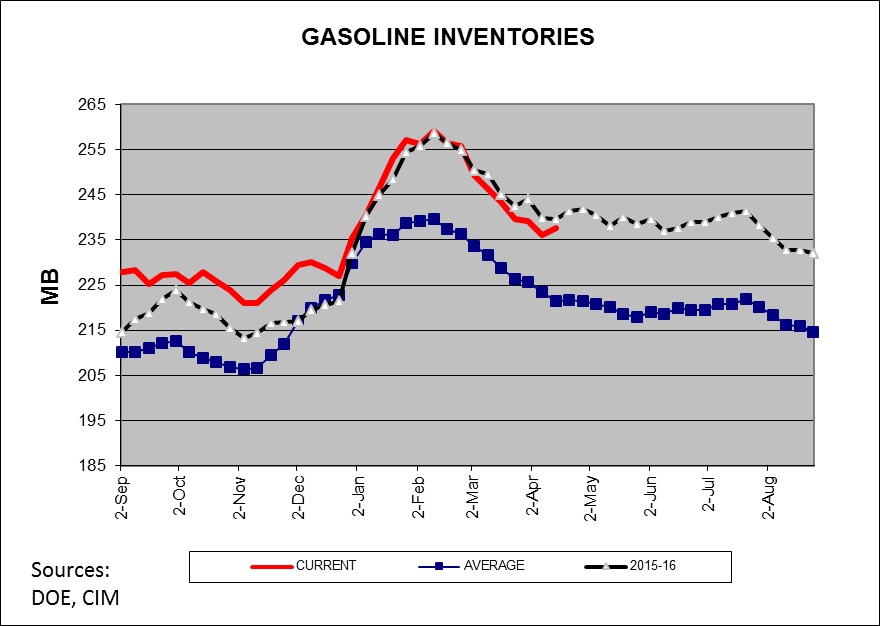
This chart shows gasoline inventories. The five-year average shows the seasonal pattern; however, this year’s data is closely tracking last year. If this pattern continues, we will see mostly steady inventory levels until late July. That isn’t necessarily bad news for oil prices but it isn’t supportive, either.
Saudi Arabia is pressing OPEC to extend its production cuts and there are reports that the cartel is going along with it. This is the factor keeping prices higher. At the same time, rising U.S. production is taking share away from OPEC. As we have stated before, the oil market is being supported by what we would describe as epic “window dressing” in front of the Saudi Aramco IPO next year.
A secondary factor helping U.S. oil production, beyond OPEC propping up oil prices, is lower yields on junk bonds.
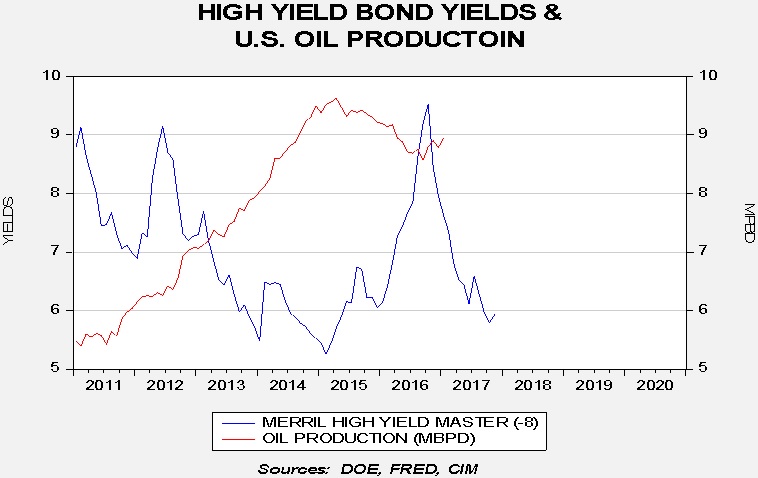
Since 2011, the correlation is a respectable -55% between the two series, with yields leading production by eight months. Obviously, oil prices play a larger role but the combination of higher oil prices and a favorable financing environment will tend to support higher U.S. production. Although higher U.S. output may be modestly negative for oil prices, it is supportive for U.S.-oriented oil producers…at least until the Saudis decide to retake market share.