

Asset Allocation Weekly (July 28, 2017)
by Asset Allocation Committee
As the S&P 500 steadily rises to new highs, concerns about a correction will likely increase. Since 1987, major market pullbacks have been associated with recessions and there isn’t much evidence to suggest the business cycle is set to turn. In the absence of a recession, we tend to look for factors that could trigger a market decline.
The first factor we are watching is liquidity.
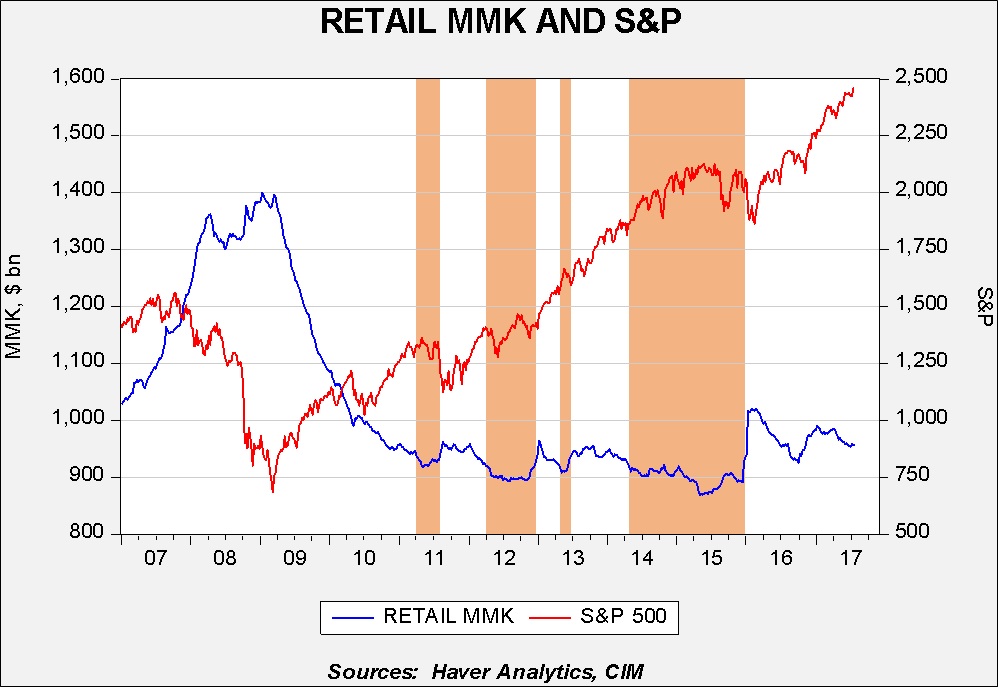
This chart examines the S&P 500 on a weekly close basis compared to the level of retail money market funds. Since the Great Financial crisis, equity markets have tended to trend upward until money market fund levels fall to around $900 bn. These periods are shown in orange on the above chart. It appears that households are uncomfortable with cash levels much below this level and buying tends to “dry up” once money market assets fall to around $900 bn. Current cash levels appear ample which will probably support steady gains in equities.
Exogenous events are another factor. These can be political, social, geopolitical, etc. There is a myriad of potential events that could undermine investor sentiment, including instability in the Middle East, an escalation of tensions with North Korea, a debt ceiling crisis or disappointment on tax reform, to name a few. In terms of the usual political cycle, we are rapidly approaching a period where “disenchantment” sets in.
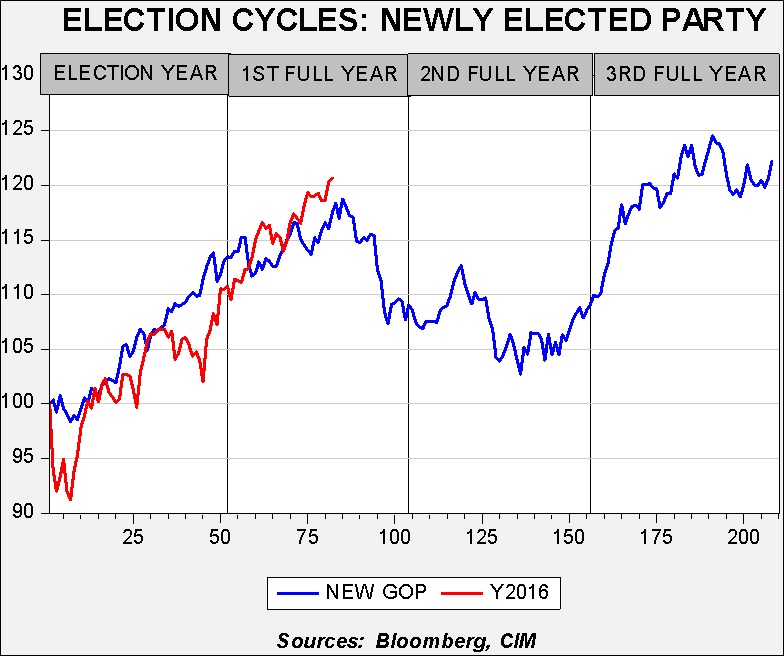
This chart shows the performance of the S&P 500 on a weekly close basis, indexed to the first weekly close of the election year. Our study begins in 1928. We have segregated new GOP administrations in the average and compared market action to the current administration. Although the fit isn’t perfect, the general direction of the market under Trump is reasonably consistent with past incoming Republican presidents. If the pattern continues, this study would suggest a period of weakness is in the offing. We use these studies more for signals of trend, not necessarily as pure forecasts. And, because they are historical studies, their relevance is somewhat questionable in that the issues surrounding each administration are different. Still, the chart does suggest that a GOP win initially raises investor sentiment but this sentiment appears to deteriorate sometime in late summer of the first year in office, as the difficulties of legislating become more obvious. With the current turmoil in Washington, not to mention a broad set of geopolitical issues, a period of market turbulence would not be a shock.
Combining the two studies would suggest that there is enough available liquidity to prevent a significant pullback as suggested by the election year chart. We would not be surprised to see a few weeks of market consolidation, especially if tax reform talks stall or other issues arise. However, there is nothing in the data that suggests a recession is imminent and thus pullbacks in equities will probably be modest.