

Asset Allocation Weekly (August 10, 2018)
by Asset Allocation Committee
Last year, we introduced an indicator of the basic health of the economy and added it to the many charts we monitor to gauge market conditions. The indicator is constructed with commodity prices, initial claims and consumer confidence. The thesis behind this indicator is that these three components should offer a simple and clear picture of the economy; in other words, rising initial claims coupled with falling commodity prices and consumer confidence is a warning that a downturn may be imminent. The opposite condition should support further economic recovery. In this report, we will update the indicator with the July data.
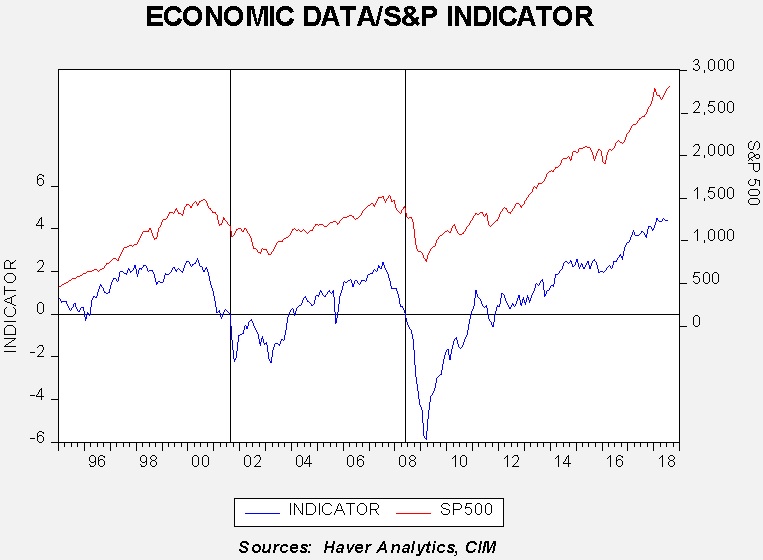
This chart shows the results of the indicator and the S&P 500 since 1995. The updated chart shows that the economy is doing quite well. We have placed vertical lines at certain points when the indicator falls below zero. Although it works fairly well as a signal that equities are turning lower, there is a lag. In other words, by the time this indicator suggests the economy is in trouble, the recession is likely near or underway and the equity markets have already begun their decline.
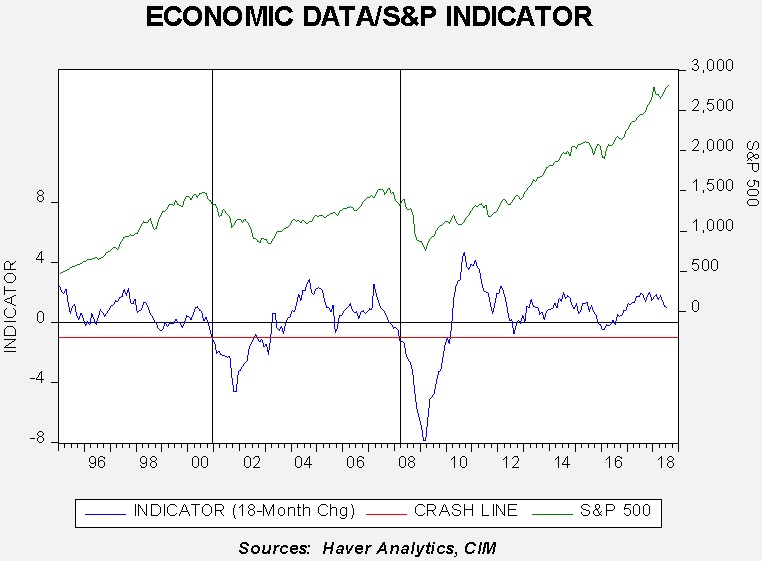
To make the indicator more sensitive, we took the 18-month change and put the signal threshold at -1.0. This provides an earlier bearish signal and also eliminates the false positives that the zero threshold generates. Notwithstanding, we will pay close attention when the 18-month change approaches zero.
What does the indicator say now? The economy is healthy and currently supportive for equity markets, although the second chart does show that momentum is starting to slow, albeit from a very high level of activity. The second chart shows that the indicator is still comfortably above the point of concern. Thus, for now, there is no economic evidence to support a major correction; if one is to occur, it will mostly likely be generated by a geopolitical event.