

Asset Allocation Weekly (August 17, 2018)
by Asset Allocation Committee
Last week, the Bureau of Labor Statistics released the CPI data for July. Inflation continues to rise; the overall rate rose 2.9% and the closely watched core rate (the rate less food and energy) rose to 2.4%, the highest rate since September 2008. Rising inflation raises policy concerns. In this week’s report, we will analyze these concerns.
The rise in interest rates will support the Federal Reserve tightening stance. To determine what the fed funds target rate “should” be, we use the Mankiw Rule model. The Mankiw Rule model attempts to determine the neutral rate for fed funds, which is a rate that is neither accommodative nor stimulative. Mankiw’s model is a variation of the Taylor Rule. The latter measures the neutral rate using core CPI and the difference between GDP and potential GDP, which is an estimate of slack in the economy. Potential GDP cannot be directly observed, only estimated. To overcome this problem with potential GDP, Mankiw used the unemployment rate as a proxy for economic slack. We have created four versions of the rule, one that follows the original construction by using the unemployment rate as a measure of slack, a second using the employment/population ratio, a third using involuntary part-time workers as a percentage of the total labor force and a fourth using yearly wage growth for non-supervisory workers.
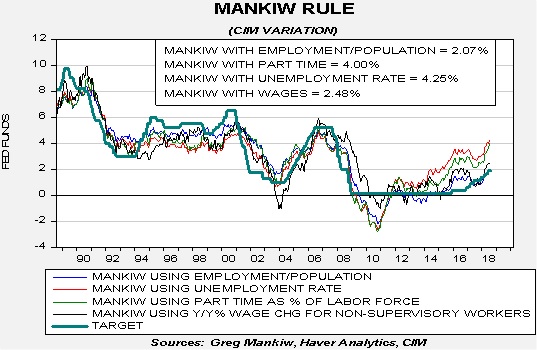
Using the unemployment rate, the neutral rate is now 4.25%, up from last month’s estimate of 4.00%, reflecting the fall in the unemployment rate and the rise in inflation. Using the employment/population ratio, the neutral rate is 2.07%, up from 1.84%. Using involuntary part-time employment, the neutral rate is 4.00%, up from the last calculation of 3.68%. Using wage growth for non-supervisory workers, the neutral rate is 2.48%, roughly unchanged from the last report of 2.41%. All the variations show a rise in the neutral rate; two of them, the traditional one with the unemployment rate and the rate using involuntary part-time employment, are 4.00% or above. The other two calculations are showing more slack in the economy, although both still suggest the FOMC needs to raise rates further. The model based on the employment/ population ratio suggests one more hike of 25 bps to reach neutrality and three more times to achieve that level for the wage growth variation.
To determine the market’s projection for policy, we use the implied three-month LIBOR rate from the two-year deferred Eurodollar futures market. In the past, it has been a reliable measure of the terminal fed funds rate.
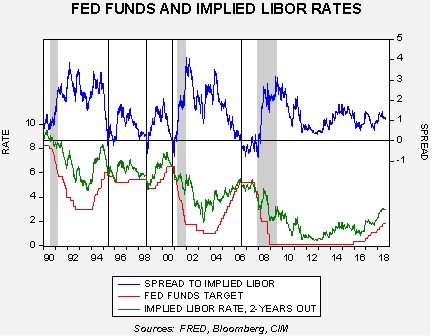
The top line on the chart shows the spread between the implied LIBOR rate and the fed funds target. We have placed vertical lines where the spread inverts and gray bars for recessions. In the 1990s, Chair Greenspan faced two periods when the spread inverted; both times he cut rates[1] and was able to extend the expansion. He was unable to avoid recession in 2001 despite aggressive cuts to fed funds, but that recession was considered to be unusually mild. The Bernanke Fed did not lower rates when the spread inverted in 2006, leading to a period of extended policy tightness which may have increased risk to the economy.
Despite the rise in inflation, the implied three-month LIBOR rate from the two-year deferred Eurodollar futures market did not rise; in fact the most recent reading is 2.95%, suggesting the FOMC should stop raising rates when the target reaches 3.00%. That still means five rate hikes are being discounted by the financial market. Assuming two more this year, the Eurodollar futures are suggesting three hikes would be on tap for 2019.
The differences in the Mankiw Rule variations mean that the projected 3.00% rate would likely signal recession if the proper measure of slack is either the employment/population ratio or wage growth variation. On the other hand, if the true measure of slack is the unemployment rate or involuntary part-time variation, then the Fed is running the risk of either triggering an inflation problem or inflating an asset bubble. How do we know which is the best measure of slack? There really is no good way to know for sure but if forced to choose we would select the wage growth variation as probably the best gauge. Why? Because overly tight labor markets should push wages higher and the fact that wage growth remains sluggish probably means there are “pockets” of workers still being drawn into the labor force. The fact that the labor force is continuing to expand confirms this notion. The argument against the wage growth variation is the idea that the labor market has become an oligopsony, meaning that firms have market power over labor and are holding down wages despite the lack of workers. Although this is possible, we doubt this factor can hold down wages indefinitely.
If the wage growth variation is the correct measure of slack, we are still three tightening events away from neutrality. Thus, for the time being, the risk of the FOMC overtightening and triggering a recession is low. Nevertheless, the danger will rise by early next year and the risks of recession will rise appreciably by the second half of next year, assuming the Fed continues to ratchet rates higher. We continue to closely monitor this dynamic into next year.
[1] However, the cut in 1998 was prompted more by the Long-Term Capital Management collapse that threatened the financial system.