by the Asset Allocation Committee | PDF
- Our three-year forecast includes a relatively mild recession followed by a recovery and the prospect for an economic expansion.
- Geopolitical tensions are elevated with heightened potential for increased turmoil in the Middle East.
- Inflation should moderate in the near-term but may reaccelerate within the forecast period due to structural influences such as deglobalization and labor market tightness.
- The Fed’s monetary policy is likely to ease as economic conditions slow, and we expect a measured and careful approach by the FOMC as the presidential elections draw near.
- We have extended duration by stepping into long-term Treasury bonds for their safety element.
- In domestic equities, we maintain our value bias as well as cyclical sectors and quality factors.
- Exposure to international developed markets was reduced due to continued monetary policy tightening from most developed market central banks.
ECONOMIC VIEWPOINTS
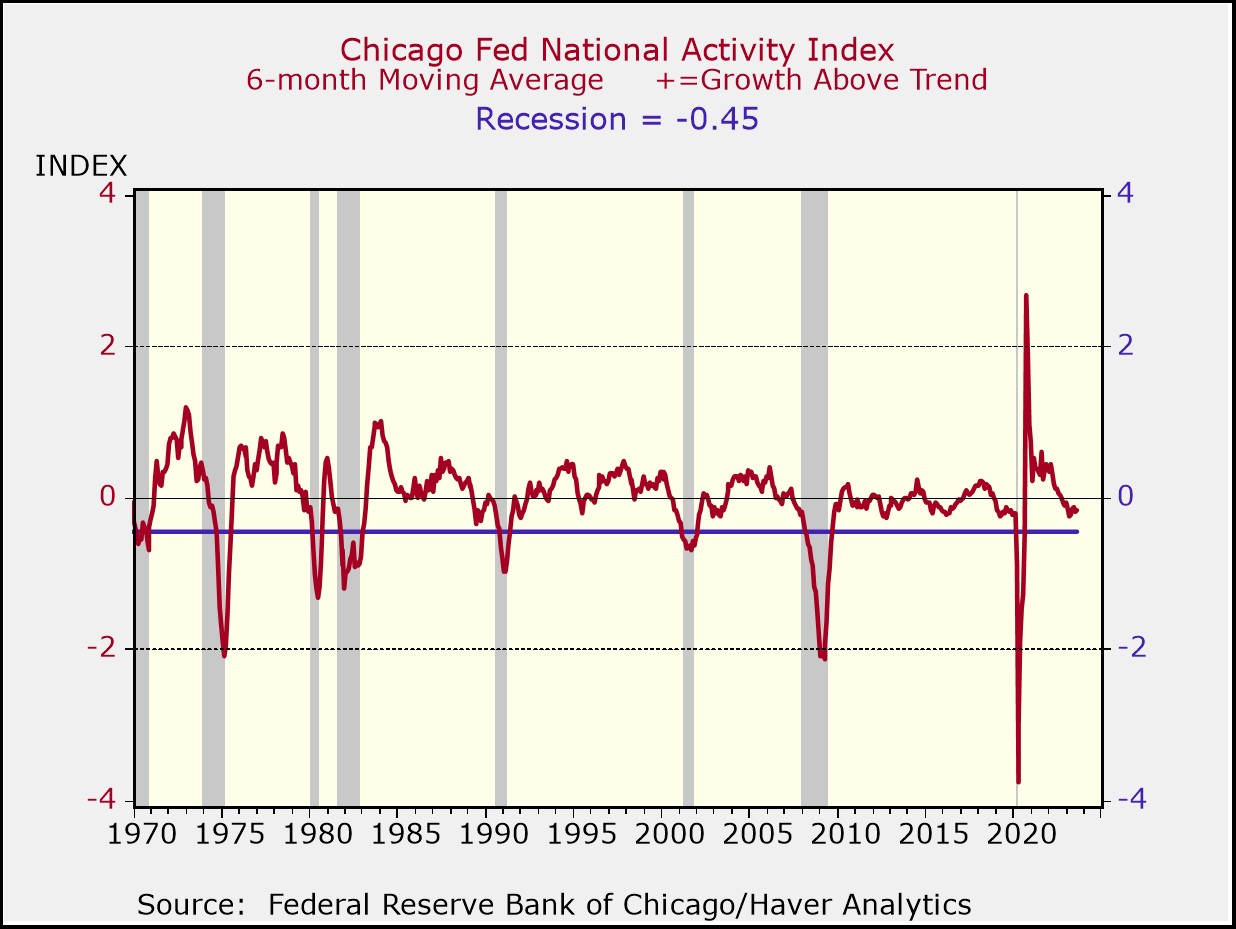
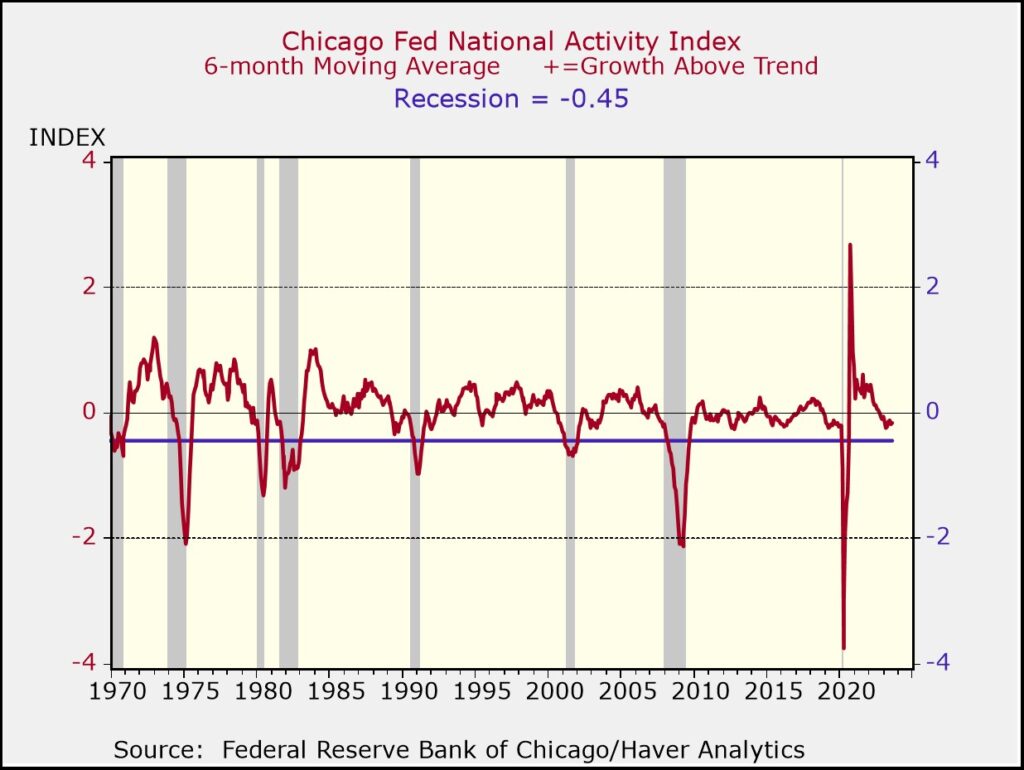
We are still anticipating a mild recession followed by a recovery within our three-year forecast period. While GDP growth has been positive, real-time indicators, such as the Chicago Fed Activity Index and the LEI, are exhibiting slowing growth. The long wait for an impending recession is a self-destructing prophecy to a degree—the more time that market participants have to prepare for a recession, the more opportunity they have to right-size their balance sheets and the less severe the recession is likely to be. Additionally, the Fed is close to, if not at, peak fed funds rates according to many indicators. No further hikes would support the economy and possibly avert a recession but would also allow inflation to run higher than the Fed’s 2% target rate.
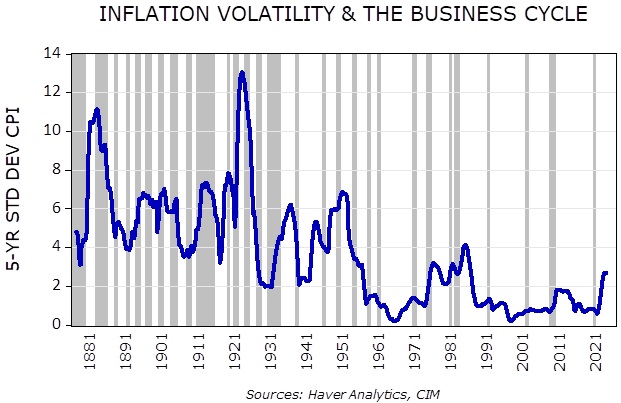
Inflation has fallen recently, likely in response to the short-term smoothing of supply-chain problems and tighter monetary policy. Our expectation is that the volatility of inflation will be elevated within the forecast period due to underlying structural issues, such as deglobalization and labor market tightness. The U.S. labor market is expected to remain tight due to demographic shifts following the pandemic-prompted constriction of the 55+ age group labor pool and changing immigration policies. While the workforce is constrained, demand for workers has remained strong due to labor-hoarding and re-shoring. This has caused wage growth to persist at higher levels as compared to pre-pandemic periods. More importantly, wage growth has exceeded inflation over the past few months.
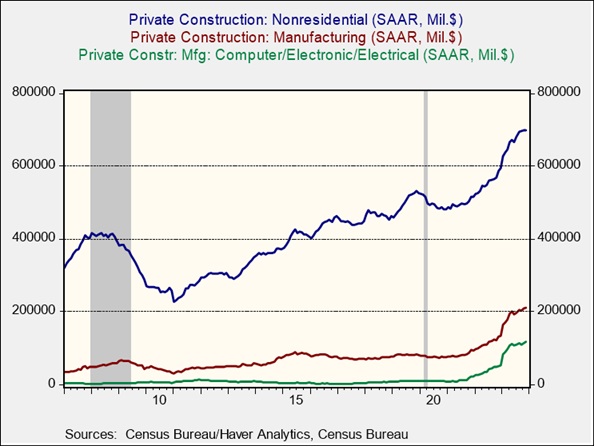
A significant longer-term mega-trend supporting domestic economic activity is the re-shoring of manufacturing capacity, including domestic reindustrialization and shortening supply-chains. Geopolitical tensions are likely to remain elevated, further encouraging international polarization into geopolitical blocs. Corporate fixed-asset investment, a proxy for manufacturing capacity expenditures, has been strong following the passage of the CHIPS and Inflation Reduction Acts. Capacity buildouts are multi-year endeavors, which will place increasing demands on construction, labor, and materials initially and skilled labor to operate in the long-term. We believe these pressures, combined with general supply-chain complexities, will further expose inflationary bottlenecks within the economy that will magnify inflation volatility.
The consequences of deglobalization are unfolding, such as the ongoing war in Ukraine and a geopolitical tragedy in the Middle East, which bear the potential to escalate unexpectedly and swiftly. Moreover, while the 2024 U.S. presidential election is rapidly approaching, the market is typically less concerned with the specific election outcome but it does have an aversion to uncertainty. From a market volatility perspective, a quick resolution to the primaries would be beneficial.
STOCK MARKET OUTLOOK
Given the long anticipation of a recession, corporations have likely had opportunity to optimize their inventories and liabilities, hence a deep recession is less likely. Additionally, domestic equity valuations could be supported by U.S. investors repatriating capital due to global geopolitical tensions and the historically high level of cash on the sidelines. Currently, the Technology sector accounts for approximately 28% of the S&P 500, and while optimism around AI and machine learning is strong, earnings within the sector have not kept up with the optimism. It will likely take years for AI to translate to productive uses, similarly to other transformational innovation such as the internet, electricity, and automobiles. In addition to our style tilt toward value over growth, we retain our Aerospace & Defense position and cyclical sector overweights in Energy, Metals & Mining, and Industrials. Remilitarization is accelerating as we see increased conflicts globally. The Mining and Energy sectors are likely to benefit from electrification/green energy policies as electrification is metals heavy.
We remain committed to our value bias across all market capitalizations. We view the sustainability of earnings growth as more attractive in equities categorized as value, with their valuation multiples remaining modest compared to historical data. In addition, the value style has a lower exposure to sectors that we view as overpriced. Although growth has vastly outperformed value year-to-date, we anticipate that we are in the early stages of a value outperformance cycle.
We believe that small and mid-capitalization stock valuations are attractive, with fundamentals continuing to be healthy. Mid-cap stocks remain at historically wide valuation discounts to large cap stocks. We maintain the quality factor, which screens for profitability, leverage, and cash flows, in our small and mid-cap exposures to limit potential risks during economic volatility. This quarter, we introduced a position in a uranium producers industry ETF within our mid-cap exposure. The changing nature of baseload energy production and the policies shaping it have created an opportunity for nuclear energy. Green energy policies have set ambitious goals for reducing fossil fuel usage, while the new green energy technologies cannot currently produce energy to the scale and consistency needed. With the supply of uranium having become crimped over the past decade, we view the supply/demand imbalance to offer a solid opportunity for the exposure.
We reduced our exposure to international developed equities in several strategies, but allocations remain in the more risk-tolerant portfolios. Although valuations remain low, risks have increased. Most developed market central banks persist on the tightening path in an attempt to control inflation. At the same time, economic growth is showing signs of slowing. This creates an environment for potential policy-driven errors. Given the increased geopolitical risks and re-shoring supply-chain activity, the U.S. dollar strength cycle has the potential to extend further than previously anticipated, resulting in additional downward pressure on international equities. Accordingly, in the Aggressive Growth strategy, we exited the emerging markets position due to increased geopolitical and economic growth risks. We believe that return/risk trade-offs are more attractively presented in domestic equities for the more risk-accepting portfolios.
BOND MARKET OUTLOOK
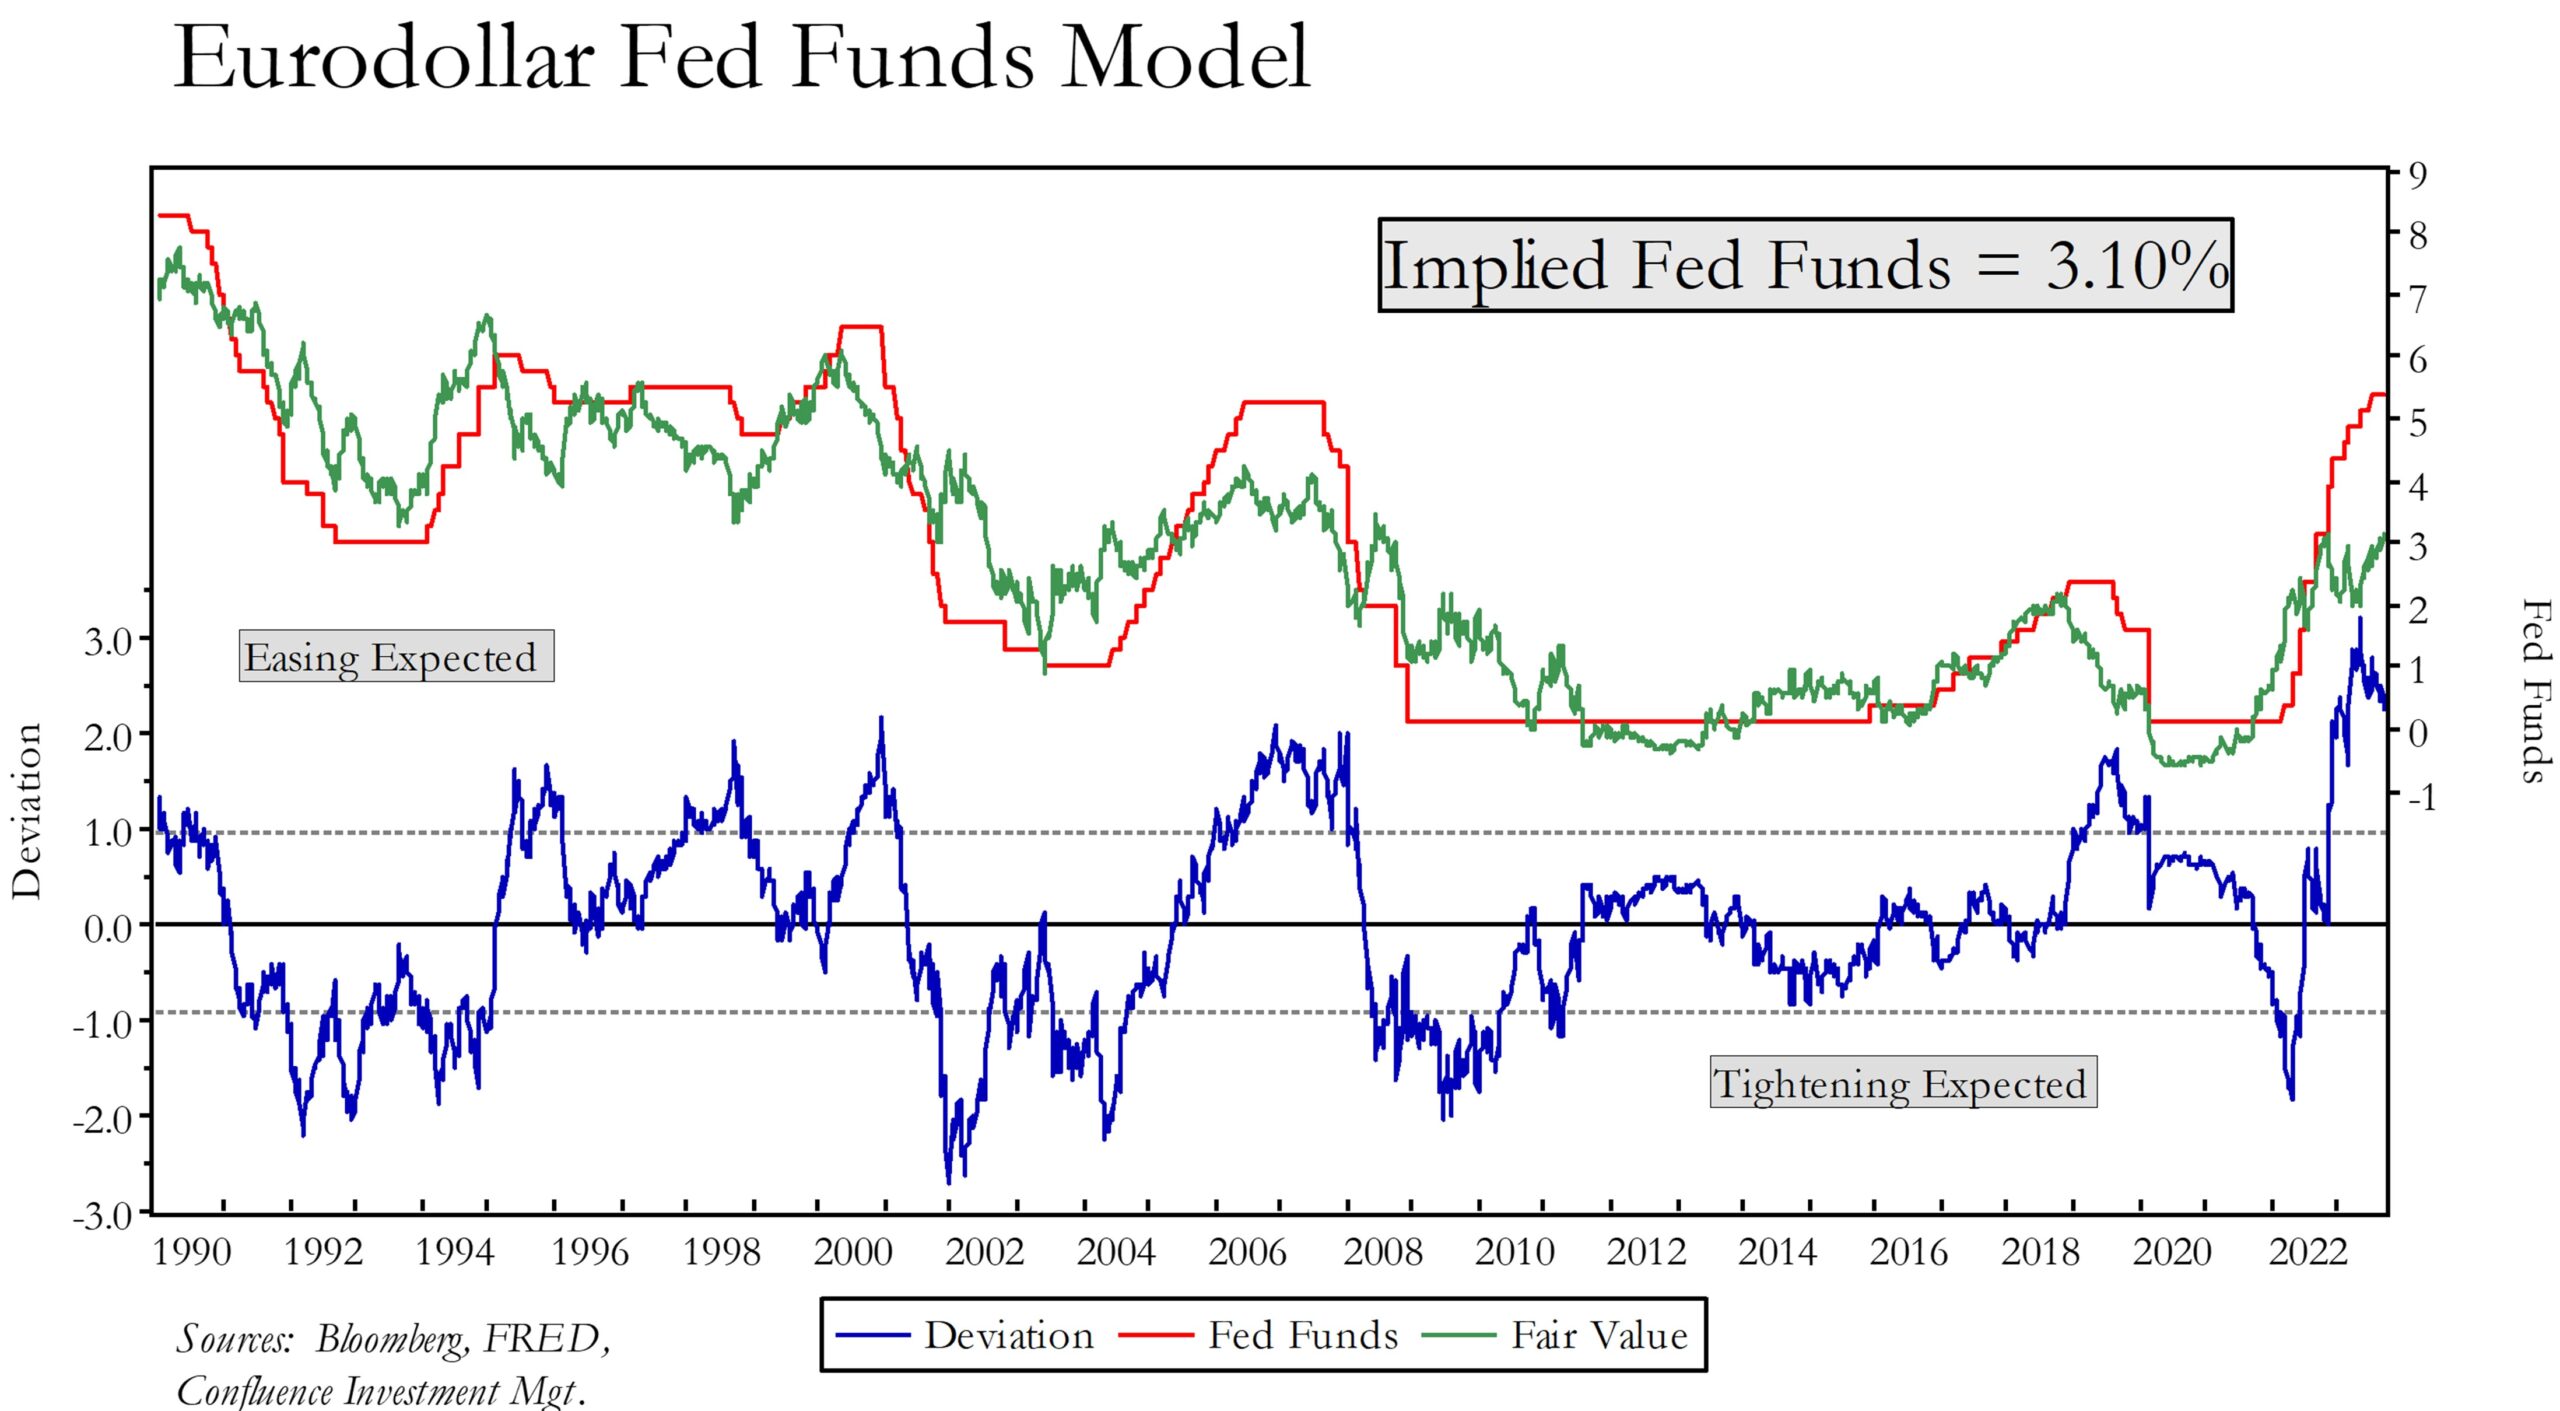
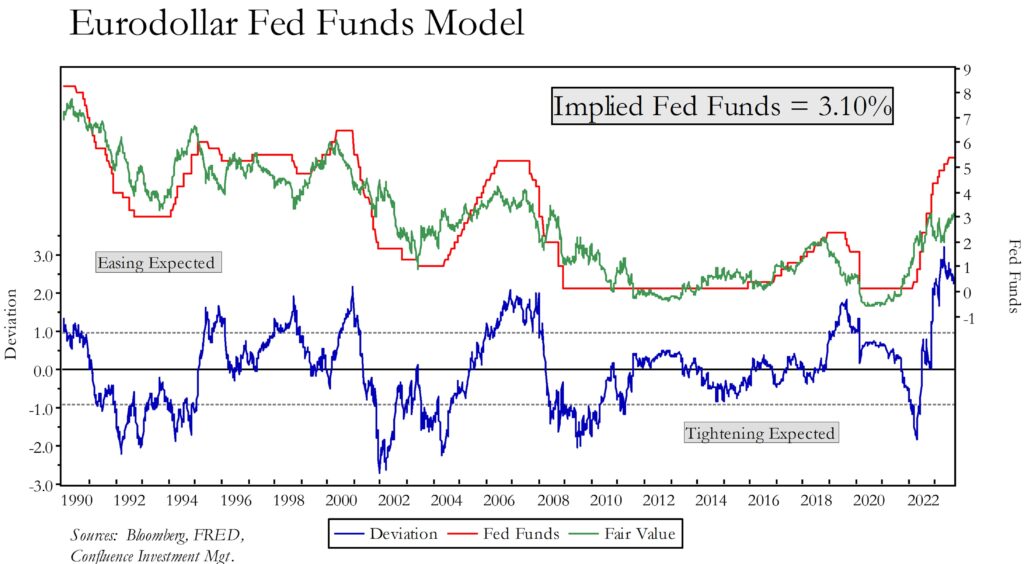
Although the quarter commenced with the market split in its anticipation of a Fed pause versus another increase in the fed funds rate prior to year-end, we believe that inflation will continue to moderate over the next several quarters and, accordingly, the Fed’s monetary policy will begin to ease. This chart indicates that the fed funds rate is well above its implied rate. Naturally there are potential curbs to our assessment, such as the structural forces of deglobalization that have the potential to keep inflation elevated above the Fed’s 2% target. Moreover, the aforementioned mega-trends will likely lead to greater volatility of inflation, especially relative to the docile environment that persisted during the period following the Great Financial Crisis. Nevertheless, the near-term outlook is for the inflation-fighting vehemence of the Fed to modulate, especially as the composition of its voting members turns more dovish next year. Consequently, we find the duration trade to be less fraught with the potential for turbulence that has existed since early 2022, and we expect the yield curve will flatten from its current inversion. This lends us the latitude to extend duration in the strategies from their prior concentration in the short-end and even place limited exposure to long-term U.S. Treasuries to hedge against the potential for even more increased geopolitical risks or a more severe recession.
The expectation for an economic contraction encourages a degree of caution toward investment-grade corporates. While companies carrying investment-grade ratings have sound balance sheets and have termed out their debt, thus avoiding a “debt wall” in the near-term, spreads to Treasuries remain contained relative to historical averages. In contrast, spreads on speculative grade bonds have risen to the point where we find it advantageous to selectively add to our exposure. Although the refinancing wave is poised to affect companies rated B and below over the next two years, with attendant difficulties for their cost of capital, our spec bond position is strictly held in the BB-rated segment which has little exposure to floating rate debt and can be characterized as an equity surrogate where incorporated.
OTHER MARKETS
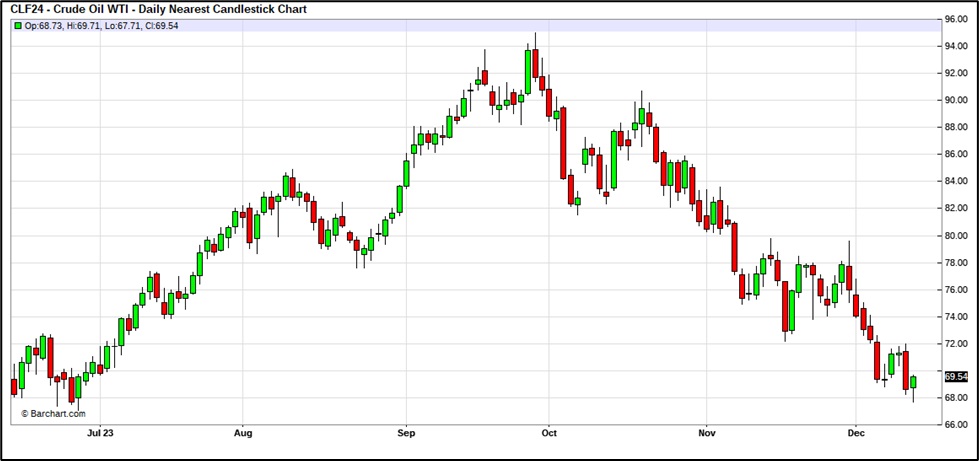
Despite the currently low valuations of REITs, we expect the sector to continue to lag heading into an economic contraction and a continued high interest rate environment. Therefore, allocations to REITs remain absent in all strategies. In the commodity segment, we maintain a position in gold as a flight to safety asset during economic contractions and as a hedge against elevated geopolitical risks. For portfolios where the allocation to commodities is larger than 5%, we are adding a position in a broad-based commodity ETF with exposure to oil, gas, metals, and agriculture. Turmoil in the Middle East tends to support the broad commodity complex, especially oil and its derivatives.
Read the full report
Asset Allocation Fact Sheet