

Author: Rebekah Stovall
Asset Allocation Weekly (March 6, 2020)
by Asset Allocation Committee
In the turmoil caused by COVID-19, fixed income has performed remarkably well. Ten-year T-note yields have declined to record lows and, as we will show below, there is no evidence of severe stress in the credit markets.
First, here is what we are seeing in Treasuries.
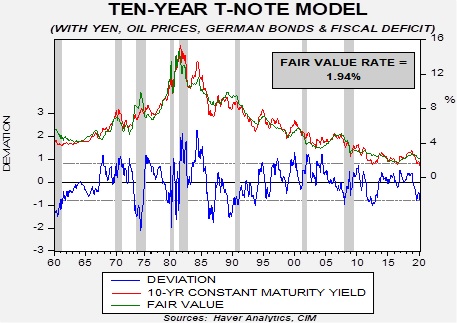
This chart shows our 10-year T-note model. It uses fed funds, the 15-year average of inflation,[1] the yen/dollar exchange rate, oil prices, German bund yields and fiscal deficits as a percentage of GDP. At the end of last year, the fair value was around 2.40%; as the above chart shows, it has declined sharply to 1.94%. Of course, that yield remains well above current yields. The implied three-month LIBOR rate from the two-year deferred Eurodollar futures suggests the financial markets expect another 50 bps of rate cuts over the next two years. Even assuming a 0.75% fed funds target only lowers the fair value to 1.84%. Assuming those rate cuts at a German bund yield of -3.60% (a decline of 300 bps from current levels) would get the model to current yields. A negative yield to that level would be unprecedented. The most likely justification for current yields would be a sharp drop in inflation expectations. If inflation expectations decline to 1% per year along with the assumption of 100 bps of rate cuts, that would justify current yields. This analysis suggests that long-duration Treasuries are richly valued at current levels, and if our base case that COVID-19 won’t trigger a recession is accurate, then a back-up in these yields would be expected.
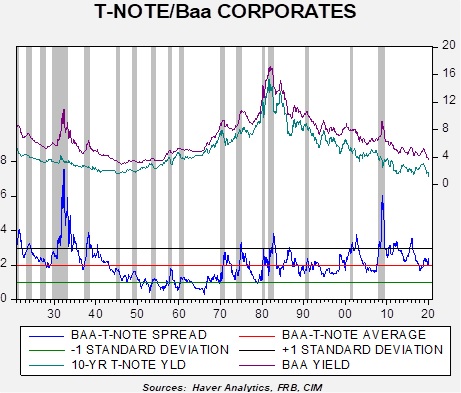
What is perhaps most interesting is that there has not been a strong reaction in credit. Comparing the 10-year to Baa yields shows that spreads have not moved significantly, only around 30 bps.
In high yield, spreads have widened as well, but the increase is not notable so far.
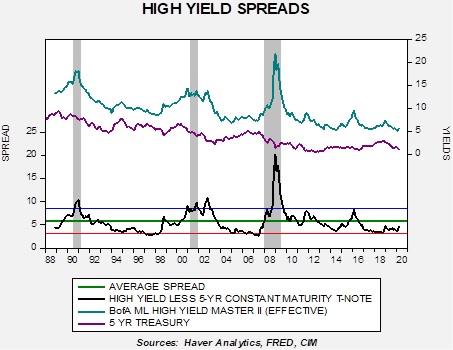
Yields have increased by 80 bps but remain 120 bps below average.
The lack of pressure in the credit markets, at least to this point, suggests the current situation probably won’t evolve into deep financial crisis or a recession. We will continue to monitor the credit markets closely in the coming weeks, but financial stress appears quite manageable for now.
[1] Which is a proxy for inflation expectations.
Weekly Energy Update (March 5, 2020)
by Bill O’Grady, Thomas Wash, and Patrick Fearon-Hernandez, CFA
Crude oil inventories rose 0.8 mb compared to the forecast rise of 3.0 mb.
In the details, U.S. crude oil production rose 0.1 mbpd to a new record of 13.1 mbpd. Exports rose 0.5 mbpd, while imports were unchanged. The inventory build was less than forecast due to rising exports and steady imports.
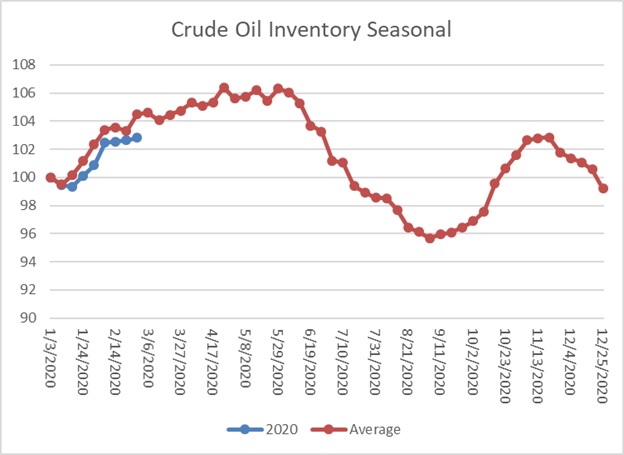
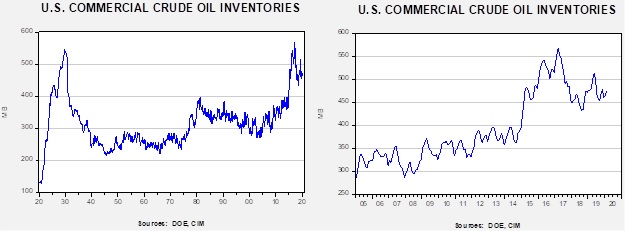
This chart shows the annual seasonal pattern for crude oil inventories. This week’s report was less than the usual seasonal patterns, and the gap between the normal pace of inventory accumulation and the actual widened modestly.
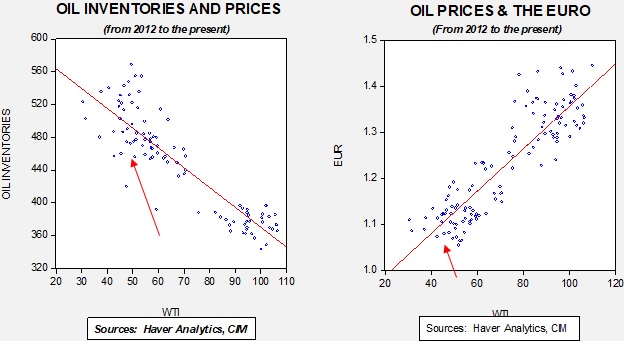
Based on our oil inventory/price model, fair value is $59.19; using the euro/price model, fair value is $46.44. The combined model, a broader analysis of the oil price, generates a fair value of $50.08. Oil prices have stabilized this week. OPEC has reportedly agreed to a 1.5 mbpd production cut; it is unclear if Russia is participating. This decision comes not a moment too soon as we are hearing reports that tankers are being used for floating storage, a clear sign of oversupply.
Weekly Geopolitical Report – Investment Implications of Changing Demographics: Part III (March 2, 2020)
by Patrick Fearon-Hernandez, CFA
In Part I of this report, we looked at current key global population trends. The report discussed how plunging birth rates have been weighing on population growth and boosting average ages all over the world, with a potentially huge impact on the distribution of geopolitical power, economic prospects and future investment returns. In Part II, we showed how these demographic trends are playing out for the world’s sole superpower and most important economy: the United States.
This week, in the final segment of this report, we’ll dive deeper into the economic implications of slowing population growth and an aging population. Our analysis will show that these demographic trends are likely to weigh heavily on future economic growth and inflation. The trends may well impact standards of living and constrain monetary and fiscal policy in important ways. We’ll conclude with a discussion of the long-term ramifications for investors, although it’s important to remember that many other forces can have a greater impact on investment returns in the short term.
Asset Allocation Weekly (February 28, 2020)
by Asset Allocation Committee
Since the end of the Financial Crisis, there has been a steady deterioration in investment-grade credit quality.
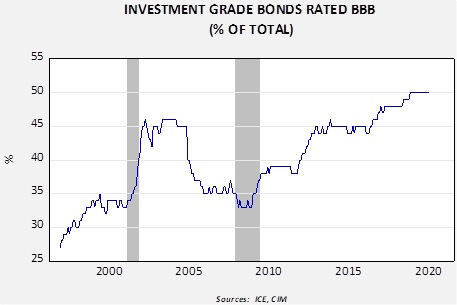
This chart shows the percentage of investment-grade bonds rated at BBB. Since late 2018, this portion has represented half of outstanding investment-grade credit. This rating is the lowest end of investment-grade credit, so the dominance of this segment raises questions about the stability of these corporate bonds under deteriorating financial conditions.
History tends to show that monetary policy has the most significant impact on the percentage of BBB debt.
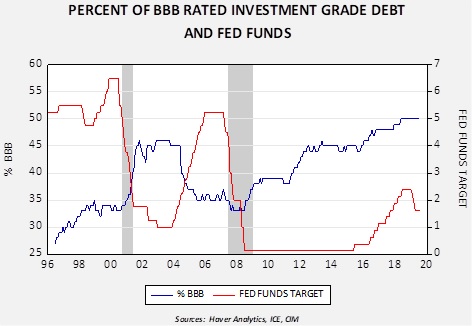
A rising policy rate between 2004 into 2006 coincided with a sizeable decline in the percentage of BBB-rated debt in the investment-grade category. Low rates since 2008 led to a steady rise in the percentage of BBB-rated debt. Most notably, the policy tightening from 2016 into last year did not slow the rise, suggesting investors did not believe that monetary policy would lead to concerns about credit quality.
This data suggests a couple of issues. First, the current high level of low-rated debt in investment-grade is a concern if the economy weakens or policymakers overtighten. Second, investors appear confident that neither outcome is likely in the short run and, if anything, the FOMC will react quickly to protect the economy from trouble. The risk, of course, is that either this confidence is misplaced or a circumstance will develop to which no amount of policy stimulus can prevent credit deterioration.
In response to this deterioration of credit quality, we have reduced our overall exposure to investment-grade credit in our allocations to fixed income. However, we remain overweight to investment-grade, in part, due to expectations that a recession or a credit event isn’t imminent.
Business Cycle Report (February 27, 2020)
by Thomas Wash
The business cycle has a major impact on financial markets; recessions usually accompany bear markets in equities. We have created this report to keep our readers apprised of the potential for recession, which we plan to update on a monthly basis. Although it isn’t the final word on our views about recession, it is part of our process in signaling the potential for a downturn.
January saw broad improvement in the economic data. The signing of the “Phase One” trade deal offered reassurance that the impact of the trade war would be limited in 2020. Several sentiment indicators surged, likely in response to the development. The NFIB Small Business Optimism Index, Chicago National Activity Index, Philly Manufacturing Outlook and Consumer Confidence, which is featured in the diffusion index, all improved during the month. In addition, financial markets offered mixed signals about the resiliency of the economic expansion due to growing uncertainty about the global economy. Conflict between the U.S. and Iran following the death of Qassem Soleimani and the COVID-19 outbreak in China reignited fears of the U.S. economy’s exposure to geopolitical risks. As a result, there was a slight deterioration in the gains made in equities and flattening along certain areas of the yield curve. Nevertheless, positive gains in employment and improvement in manufacturing activity suggests the economy remains strong. Our diffusion index has improved from the previous month with nine out of 11 indicators in expansion territory. The reading for January rose to +0.636 from +0.576.
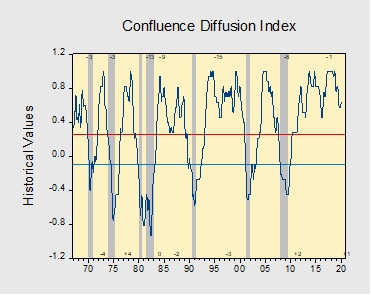
The chart above shows the Confluence Diffusion Index. It uses a three-month moving average of 11 leading indicators to track the state of the business cycle. The red line signals when the business cycle is headed toward a contraction, while the blue line signals when the business cycle is headed toward a recovery. On average, the diffusion index is currently providing about six months of lead time for a contraction and five months of lead time for a recovery. Continue reading for a more in-depth understanding of how the indicators are performing and refer to our Glossary of Charts at the back of this report for a description of each chart and what it measures. A chart title listed in red indicates that indicator is signaling recession.
Confluence of Ideas – #8 “2020 Geopolitical Outlook” (Posted 2/25/20)
Weekly Geopolitical Report – Investment Implications of Changing Demographics: Part II (February 24, 2020)
by Patrick Fearon-Hernandez, CFA
In Part I of this report, we looked at current key global population trends. The report showed how plunging birth rates have been weighing on population growth and boosting average ages all over the world, potentially having a huge impact on the distribution of geopolitical power, economic prospects and future investment returns. An important countertrend is that urbanization is accelerating, with city populations growing relatively faster while rural populations stagnate or decline. Part I noted that stronger innovation and productivity could help offset the negative impact of slowing population growth and population aging, but the world’s education systems are not rising to the occasion so far.
This week, in Part II, we will show how these demographic trends are playing out for the world’s sole superpower and most important economy: the United States. Part III will dive deeper into the economic impact of slowing population growth and population aging, and, as always, conclude with a discussion of the ramifications for investors.
Asset Allocation Weekly (February 21, 2020)
by Asset Allocation Committee
In 2017, we introduced an indicator of the basic health of the economy and added it to the many charts we monitor to gauge market conditions. The indicator is constructed using commodity prices, initial claims and consumer confidence. The thesis behind this indicator is that these three components should offer a simple and clear picture of the economy; in other words, rising initial claims coupled with falling commodity prices and consumer confidence is a warning that a downturn may be imminent. The opposite condition should support further economic recovery. In this report, we will update the indicator with January data.
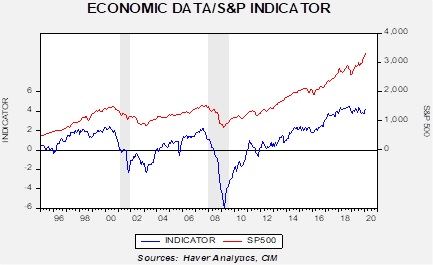
This chart shows the results of the indicator and the S&P 500 since 1995. The updated chart shows that the upward momentum in the economy has slowed but remains well above zero. We have placed gray bars to indicate recessions. The indicator was coincident with the 2001 recession but didn’t turn negative until June 2008, when the recession was well underway. Unfortunately, in its raw form, it signals trouble when the equity markets are already well into their decline.
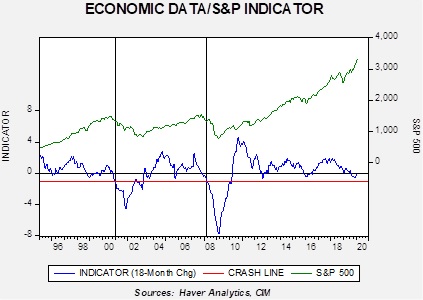
To make the indicator more sensitive, we took the 18-month change and put the signal threshold at minus 1.0. This provides an earlier bearish signal and also eliminates the false positives that the zero threshold generates. Nevertheless, the fact that this variation of the indicator is below zero raises caution.
What does the indicator say now? The economy has been decelerating but conditions have improved over the past three months, lifting this indicator back to near-zero. Thus, the improvement does suggest that investors should remain in equities based on the idea that economic conditions remain supportive. In past updates, we have expressed caution that at least rebalancing of portfolios was in order. This update would indicate that further defensive action should be put on hold for now.