

Asset Allocation Weekly (February 21, 2020)
by Asset Allocation Committee
In 2017, we introduced an indicator of the basic health of the economy and added it to the many charts we monitor to gauge market conditions. The indicator is constructed using commodity prices, initial claims and consumer confidence. The thesis behind this indicator is that these three components should offer a simple and clear picture of the economy; in other words, rising initial claims coupled with falling commodity prices and consumer confidence is a warning that a downturn may be imminent. The opposite condition should support further economic recovery. In this report, we will update the indicator with January data.
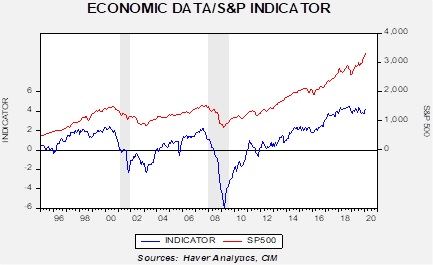
This chart shows the results of the indicator and the S&P 500 since 1995. The updated chart shows that the upward momentum in the economy has slowed but remains well above zero. We have placed gray bars to indicate recessions. The indicator was coincident with the 2001 recession but didn’t turn negative until June 2008, when the recession was well underway. Unfortunately, in its raw form, it signals trouble when the equity markets are already well into their decline.
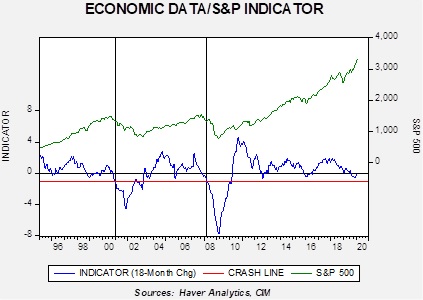
To make the indicator more sensitive, we took the 18-month change and put the signal threshold at minus 1.0. This provides an earlier bearish signal and also eliminates the false positives that the zero threshold generates. Nevertheless, the fact that this variation of the indicator is below zero raises caution.
What does the indicator say now? The economy has been decelerating but conditions have improved over the past three months, lifting this indicator back to near-zero. Thus, the improvement does suggest that investors should remain in equities based on the idea that economic conditions remain supportive. In past updates, we have expressed caution that at least rebalancing of portfolios was in order. This update would indicate that further defensive action should be put on hold for now.