IDEA Dividend Update (March 31, 2020)

A Report from the Value Equities Investment Committee | PDF

Growing dividends are at the core of Confluence’s Increasing Dividend Equity Account (IDEA) strategy. Given the unprecedented nature of a national economic shutdown to combat COVID-19, it is likely that many companies, including some that may be held in the IDEA portfolio, will choose to not grow their dividends and some may even choose to temporarily suspend or decrease their dividends during the economic shutdown. With this possibility in mind we thought it would be helpful to proactively discuss the situation and our planned response prior to any changes companies might make with their dividends.

Why are growing dividends beneficial?

First, it would probably be helpful to review why owning companies with growing dividends is a good investment strategy. When you purchase a stock, you are buying a fractional portion of a company with the expectation of receiving a share of its ongoing cash flow. Each year a company’s earnings (cash flow) may be used to reinvest to grow the company, repurchase shares, pay dividends to the owners, or possibly do all three.

Over the long term, a stock’s total return will be determined by the cash flow growth and dividends paid out to the owners. As a result, a company with a history of consistent and growing dividends indicates a company with consistent and growing cash flow – a recipe for good long-term investment returns.

The team at Confluence has a long track record of identifying and investing in companies that not only have histories of growing dividends but also have solid prospects that those dividends should continue to grow well into the future.

Why would a company temporarily suspend or decrease its dividend in the current environment?

Read the full report

Asset Allocation Quarterly (Second Quarter 2020)

  • The prospect of a recession in the U.S. is nearly a foregone conclusion. The depth will likely be severe, but the duration could be brief.
  • Actions over the past two weeks by the U.S. Federal Reserve should help mitigate the economic crisis, potentially avoiding problems faced in past downturns.
  • The stimulus package signed into law on March 27 offers further assistance for lessening the duration of the contraction.
  • Our three-year forecast is for a recovery and even the potential for expansion toward the end of the forecast period.
  • Risk assets, especially U.S. equities and even corporate bonds, are at attractive valuations in our view.
  • Each strategy now has elevated exposure to equities with a tilt toward growth over value.
  • Though long-term Treasuries have likely run their course, the use of gold as a stabilizer for the strategies remains appropriate.

View the complete PDF


ECONOMIC VIEWPOINTS

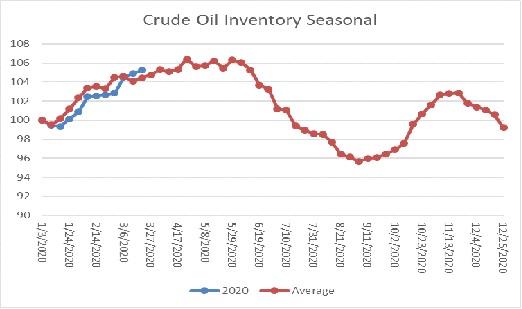
The COVID-19 virus has plunged the U.S. and global economies into a recession faster and more violently than anyone had forecasted even a month ago. Sheltering at home has ground economic activity to a near-standstill and has resulted in an astounding increase in unemployment claims and consequent business inactivity. Nearly simultaneously, the price of oil has collapsed, owing to the market share battle waged between the Kingdom of Saudi Arabia [KSA] and Russia. A third concern, that of increasing financial stress, has been addressed and potentially allayed by the recent actions of the Fed. Since the beginning of March, the Fed has responded with the following, among other measures:

  • Cutting fed funds by 1.50% to 0.00%-0.25%;
  • Expanding its repo operations, effectively offering an unlimited amount;
  • Resuming Quantitative Easing as open-ended, announcing thee intention to buy $375 billion in Treasuries and $250 billion in mortgage-backed securities for the week of March 23 alone;
  • Supporting money market funds through the Money Market Mutual Fund Liquidity Facility, allowing banks to pledge collateral they purchase from prime money market funds.
  • Resurrecting the Primary Dealer Credit Facility, offering rates as low as 25 basis points to primary dealers with investment-grade debt, including municipals, and equities being used as collateral;
  • Encouraging bank lending by lowering the discount window rate to 25 basis points and extending the term to 90 days from overnight;
  • Relaxing regulatory capital requirements and liquidity buffers in an effort to stimulate lending;
  • Establishing two new facilities to support high-grade U.S. corporations: the Primary Market Corporate Credit Facility – allowing the Fed to buy new corporate bond issues and extending loans; and the Secondary Market Corporate Credit Facility – allowing purchases of not only existing corporate bonds, but also ETFs holding investment-grade rated bonds.

These historic measures by the Fed have the potential to avoid the issues associated with most prior recessions where the financial system exacerbated the problems.

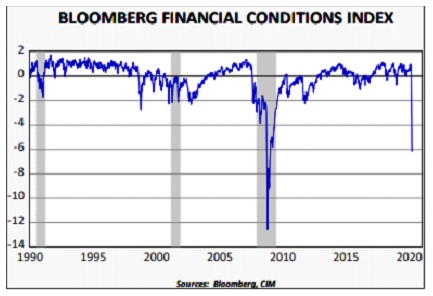
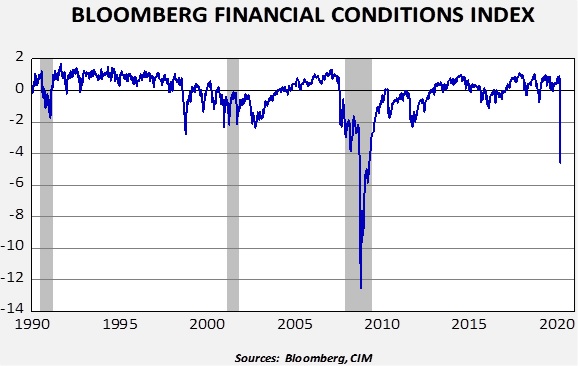
Despite the Fed’s actions, the magnitude of the impact of COVID-19 on the economy remains to be seen. Due to the lag in data reporting, many indicators won’t turn decidedly negative until reports are released in April and May. However, we have noted a sudden decline in financial conditions as measured by the Bloomberg Financial Conditions Index for the U.S., which is compiled daily and comprises eight variables.[1] The more negative the reading, the greater the level of financial stress. It clearly indicates a substantial impact from the economic inactivity inflicted by the disease.

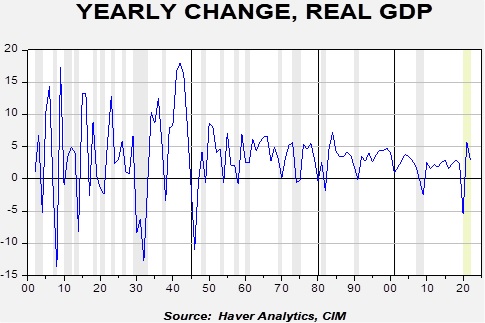
Our forecast is for a dramatic decline in U.S. GDP recorded for the second quarter of this year, with the potential to stretch into the third and fourth quarters should a second wave of the virus assert itself in autumn. However, over the full three-year forecast period, we anticipate that a U-shaped recovery will engage, accompanied by an unleashing of pent-up demand from businesses and households awash in liquidity.


[1] The eight variables contained in the index are the TED spread, LIBOR/OIS spread, commercial paper/T-bill spread, Baa/10-Year T-Note spread, Muni/10-Year T-Note spread, swap volatility, S&P 500 and VIX.

STOCK MARKET OUTLOOK

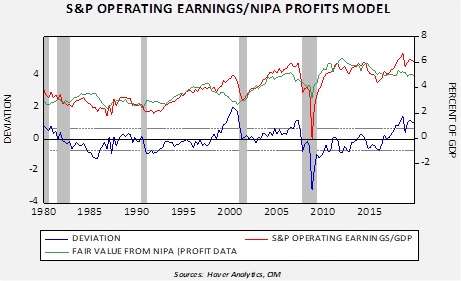
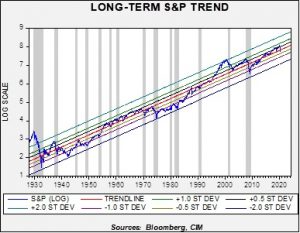
Although our near-term view is that domestic and overseas equity markets will be in search of new footing, we believe that in the absence of a policy mistake equity markets should recover over the course of our three-year forecast period. That is not to imply that in the interim all will be roses and buttercups for corporations and equity investors. The combination of the pandemic, the “oil war” between Russia and the KSA, and the global recession will naturally cripple corporate earnings. Our updated EPS estimate for the S&P 500 is $127 for 2020. A resurgence of the virus in autumn and/or a policy mistake, such as a failure to follow the $2 trillion stimulus bill with additional legislation in the event of a more severe and durable economic contraction, could plunge equity prices even lower. However, the policy responses thus far have been heartening.

The downturn may provide an opportunity for companies to write down some inflated assets, such as intangibles, and revise compensation structures to appease governance-focused institutional investors. In addition, share repurchase programs are likely to be curtailed, reducing this form of demand for shares, and in the near term, dividends may be suspended by a number of firms as they address the business impact over the next several months. However, over our forecast period, dividends are likely to become the preferred means by which to reward shareholders, thereby replacing share repurchases. Over the course of the next three years we anticipate that pent-up demand, the realignment of supply chains, and builds in corporate inventories will lead to a recovery in equity prices from today’s attractive valuations.

In summary, current pressures associated with COVID-19 and the oil war may continue to build over the next several months, placing more downward pressure on equities. However, we find valuations to be enticing, even factoring in a temporary plunge in EPS for this year. Accordingly, over our forecast period we believe that stocks hold remarkable appeal and will be viewed as such when we look in the rearview mirror in 2023.

Among U.S. equities, a tilt now exists in favor of growth over value and we increase the allocation to the quality factor focusing on profitability, earnings quality, and lower leverage. Within large cap sectors, we established an overweight to Consumer Discretionary, given expectations for performance once constrained demand from COVID-19 is revived, while maintaining the overweight to Technology and Communication Services.

In contrast, overseas developed markets hold lesser appeal, given the current and anticipated continued strength of the U.S. dollar. Until a durable catalyst for weakening the U.S. dollar becomes evident, the strategies will continue to exclude non-U.S. developed market exposure. For the more aggressive strategies, however, we find that emerging markets have largely discounted the effects of a strong dollar, COVID-19, and the oil war. Emerging markets ex-China are trading one-third lower than they were at the end of last year. Accordingly, we have introduced exposure to emerging markets in the higher risk strategies, Growth and Aggressive Growth.

BOND MARKET OUTLOOK

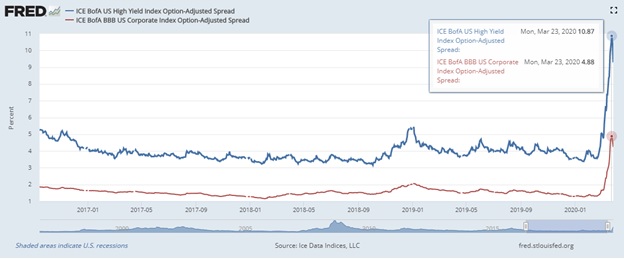
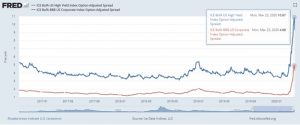
The extraordinary measures employed by the Fed have helped to ratchet down yields across the curve and thus far have effectively rescued the commercial paper and investment-grade corporate bond market. While these measures excluded the high-yield bond market, the stimulus package passed by Congress on March 27 provides the potential for remedy. Within the package is a tax carryback provision allowing companies to use losses incurred from 2018-2020 to offset profits from prior years. This may provide continued life support for a number of high-yield entities. As the chart shows, spreads for both investment-grade and high-yield corporate bonds rapidly widened over the course of the past month yet have declined over the past week due to both Fed intervention and anticipated assistance from the stimulus package.

While the Asset Allocation strategies benefited from employing long-term Treasuries as stabilizers through last quarter’s equity market turbulence, we find continued upside to be limited as there is a risk that the U.S. encounters a lift in inflation this summer from surging demand, which would pressure the long-end of the curve. The potential for an increase in rates over the full three-year forecast period encourages our substantial reduction of long-term bonds in the income-oriented strategies and their elimination from the Growth and Aggressive Growth strategies.

OTHER MARKETS

The combination of our forecast for rates and the significantly attractive pricing caused by the market decline leads to the continued exposure to REITs in the more conservative Income with Growth strategy. Although the office/retail segment will obviously struggle this year, the more diversified pool of REIT enterprises including data storage, cell towers, and timber lessens the impact retail and office formerly held.

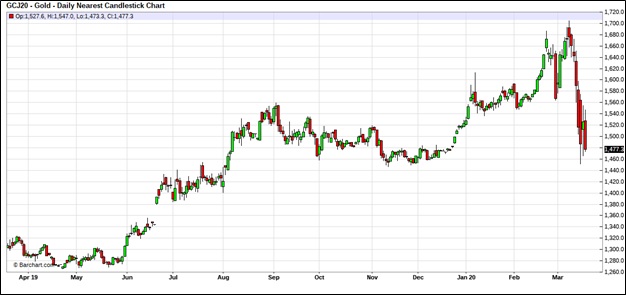
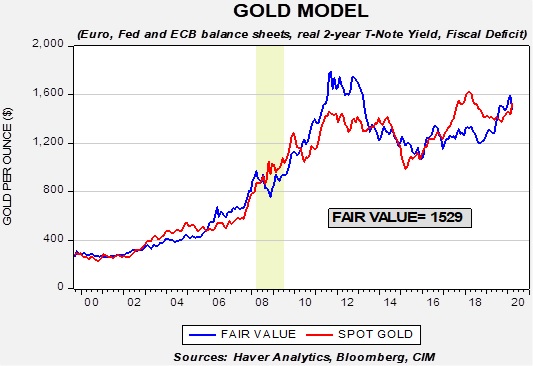
We retain the prior elevated allocation to gold given its ability to offer a potential hedge against geopolitical risk. In the more risk-seeking strategies of Growth and Aggressive Growth, gold is complemented by small positions in silver, which we find can magnify the advantages of gold. Another potential advantage of silver is that roughly half of its demand is from industrial uses, which can be supportive of its price during an economic recovery.

View the complete PDF

Weekly Geopolitical Report – Could the Coronavirus Pandemic Break Up the EU? – Part I (March 30, 2020)

by Patrick Fearon-Hernandez, CFA

In times of crisis, the future is a luxury.  Or, at least, thinking about the future can seem like a luxury, especially if you’re reeling from the death of a loved one, the loss of a job, the devastation of a retirement portfolio, or just the boredom and isolation of a quarantine.  Many people are overwhelmed with those challenges in the midst of the COVID-19 pandemic.  And yet the pandemic is changing the future course of the world in ways that we’ll all need to understand and respond to eventually.  Those future changes extend to politics and geopolitical relations.

In this report, we explore the recent signs suggesting the COVID-19 pandemic could potentially lead to a break-up of the European Union (EU).  In Part I, we examine the history of the EU, how it works, and the political and social fissures that undermine its stability.  In Part II next week, we will look at the recent policy moves by various EU countries that could lead to disintegration if carried too far.  We’ll wrap up with a discussion of the possible economic consequences of a break-up and the ramifications for investors.

View the full report

2020 Outlook Update #2: Storm Warning (March 27, 2020)

by Bill O’Grady & Mark Keller | PDF

We have been updating our 2020 Outlook to keep you informed of our thoughts as conditions evolve. We have refreshed some of the charts from our update last week and added new comments, included below in bold.

Update #2: March 27, 2020 | Update #1: March 16, 2020

Summary—High Probability of Recession:

  1. The economy is facing three simultaneous problems:
    1. A public health crisis—COVID-19 and the economic impact of containing it;
    2. An oil price war and a regional economic slump;
    3. Rapidly rising financial stress caused by (a) and (b) along with underlying unresolved issues.
  2. Although we are weeks away from data confirming that we are in a recession, the qualitative evidence leads us to say that a recession is a near certainty.
    1. We are now working from the standpoint that a recession is underway.
  3. The content of this report:
    1. An overview of how recessions look compared to expansions;
    2. A discussion of the three threats the expansion faces;
    3. The market impact of these three threats.

Read the full report

Asset Allocation Weekly (March 27, 2020)

by Asset Allocation Committee

We continue to monitor the path of the economy and markets as our expectations for a recession loom.  This week we will update our S&P 500 earnings forecast for 2020.

We use two components to build our forecast for S&P per share earnings.  First, we need to estimate GDP.  Normally, we use the GDP forecast from the Philadelphia FRB’s survey of economists.  However, under current circumstances, these forecasts are woefully out of date, so we are left to our own devices.  Any GDP forecast at present is mostly a guess; there isn’t enough data for March to project any sort of forecast for Q2.  Nevertheless, some estimate of GDP is necessary; our expectation for real GDP is a decline of 5.5% for the year 2020 with a strong rebound in 2021.  This will make the 2020 recession one of the deepest on record and the deepest yearly recession since 1946.  But, it will be short; our estimate suggests that Q2 and Q3 will be negative, with a positive Q4.

We take this forecast and calculate a nominal GDP number.  Second, we use a model to generate the S&P operating earnings margin relative to GDP.  It uses a series of variables, including unit labor costs, fed funds, NIPA profits/GDP, the euro, WTI, real net exports/GDP and corporate cash flow.  The one variable that has been of particular concern is the comparison of S&P 500 earnings/GDP compared to NIPA profits[1]/GDP; the modeled difference between these two variables has widened and, in the past, has signaled an eventual reversion would bring S&P earnings sharply lower.

The deviation line shows that when S&P earnings/GDP is elevated relative to NIPA profits/GDP, the two tend to correct during recessions.  Current levels are elevated; in a recession, history shows the two series tend to converge.

In our 2020 Outlook Update, we postulated that a recession would occur.  Our margin model shows that S&P earnings will fall to 4.5% of nominal GDP.  That lowers our estimate for 2020 S&P operating earnings to 127.00 per share.

Whenever we make a forecast, we try to determine where the most likely area of error can occur.  We note that in the last recession, the model forecast failed to capture the depths of the earnings decline.  And, in 2016, it didn’t fully account for the energy-related declines.  Thus, we may be underestimating the degree of earnings weakness that may occur.  But, for now, we will be using the 127.00 per share number for 2020, with the caveat that further downgrades are possible.

View the PDF


[1] NIPA stands for “National Income and Product Accounts” and is the formal name of the GDP accounts.  As part of that accounting, the Commerce Department calculates corporate profits for the entire economy.

Business Cycle Report (March 26, 2020)

by Thomas Wash

The business cycle has a major impact on financial markets; recessions usually accompany bear markets in equities.  We have created this report to keep our readers apprised of the potential for recession, which we plan to update on a monthly basis.  Although it isn’t the final word on our views about recession, it is part of our process in signaling the potential for a downturn.

In February, the economic data was slightly weaker than the prior month but not enough to signal recession. The coronavirus spread from China into South Korea, which raised concerns of the impact the virus would have on the global economy. As a result, equities weakened and U.S. Treasuries rallied. That being said, manufacturing showed signs of a recovery as purchasing managers were optimistic that the trade deal signed in the previous month would finally lead to an improvement in orders. Additionally, the employment numbers were strong, suggesting that prior to March there was a lot of optimism about the economy. In this report, three out of the 11 indicators were in recession territory. The reading for February fell to +0.576 from +0.636.

The chart above shows the Confluence Diffusion Index. It uses a three-month moving average of 11 leading indicators to track the state of the business cycle. The red line signals when the business cycle is headed toward a contraction, while the blue line signals when the business cycle is headed toward a recovery. On average, the diffusion index is currently providing about six months of lead time for a contraction and five months of lead time for a recovery. Continue reading for a more in-depth understanding of how the indicators are performing and refer to our Glossary of Charts at the back of this report for a description of each chart and what it measures. A chart title listed in red indicates that indicator is signaling recession.

View the complete PDF

Weekly Energy Update (March 26, 2020)

by Bill O’Grady, Thomas Wash, and Patrick Fearon-Hernandez, CFA

Crude oil inventories rose 1.6 mb compared to the forecast rise of 3.0 mb.

In the details, U.S. crude oil production fell 0.1 mbpd to 13.0 mbpd.  Exports fell 0.5 mbpd, while imports declined 0.4 mbpd.  The inventory build was less than forecast due to a modest rise in refinery operations.

(Sources: DOE, CIM)

The above chart shows the annual seasonal pattern for crude oil inventories.  This week’s report maintained the recent pattern of putting accumulations modestly above seasonal norms.  Inventories will be expected to rise steady into late May.  We will be watching this chart closely in the coming weeks for signs that inventories are rising abnormally due to the market share war described below.

Based on our oil inventory/price model, fair value is $55.20; using the euro/price model, fair value is $50.09.  The combined model, a broader analysis of the oil price, generates a fair value of $50.96.  As we noted last week, the model output is less relevant unless Russia and the Kingdom of Saudi Arabia (KSA) come to an agreement on supply.

In the coming weeks, there are two key factors we will be monitoring.  The first is the recession’s impact on product demand.  So far, there is little evidence that demand is being affected.  We do expect that we will start to see consumption decline markedly in the near future.  Second, U.S. commercial crude oil storage is around 550 mb.  If commercial inventories rise to that level, price declines could become catastrophic because there will be nowhere for that oil to go.  We approached that level in 2017 but OPEC took action to prevent further declines in prices.  The government’s decision to add to the Strategic Petroleum Reserve will help in this area but we still worry that the lack of storage capacity could have a profoundly bearish effect on oil prices.

On the international front, the U.S. is pressing the KSA to end its price war.  We doubt Riyadh will change course, but we will monitor this development.

View the PDF

Weekly Geopolitical Report – On Optimization (March 23, 2020)

by Bill O’Grady

In our discussions of COVID-19, we have noted that part of the reason the virus has been so disruptive is because the world has adopted a stance that optimization is an unalloyed positive.  When I was in graduate school, I participated in a seminar with several professional private sector economists.  A question was posed about what the goal of economics should be, and the resounding response was “efficiency.”  On its face, that position makes sense; after all, who wants to be inefficient?  But the key is how efficiency is defined and measured.

There are two underlying issues that frame optimization.  The first is the broad number of variables that may be considered in optimization.  The second is that many actions designed to optimize suffer from the error of composition.  In other words, what is rational at the micro level may be irrational at the macro level.  Both of these factors are affected by globalization, thus making them appropriate for a geopolitical report.

One of the reasons COVID-19 has had such a drastic impact on the global economy is because companies and governments have optimized to a narrow set of factors and the lack of redundancies in the system has caused breakdowns in supply chains.  As we have watched this crisis unfold, we have been struck by the fact that much of the impact was tied to the drive for optimization.

In this report, we will examine the issue of optimization.  We will start by discussing the expanse of variables considered and why market participants tend to assume that slow moving variables are constant and thus they are vulnerable when they change.  An analysis of the error of composition problem will also be included.  We will conclude with market ramifications.

View the full report

Asset Allocation Weekly (March 20, 2020)

by Asset Allocation Committee

During the recent market tumult, gold has performed rather well, until lately.

(Source: Barchart.com)

This chart shows the nearest gold futures contract over the past year.  From mid-January, when reports of COVID-19 began to circulate, gold prices marched steadily higher, making an intraday high of $1,704.30.  Since then, this has declined by over $250 per ounce.  This drop is occurring despite a series of measures designed that would normally support gold prices, e.g., the return of zero fed funds, new quantitative easing, plans for massive fiscal spending, etc.

This is a chart of our gold model.  Fair value has increased to $1,529 per ounce and prices have dropped below that level.  We suspect the recent weakness is related to a rapid tightening of financial conditions.

This chart shows the Bloomberg Financial Conditions Index. A negative reading suggests higher levels of financial stress.  When financial stress rises to high levels, investors often are scrambling for cash, selling what they can and not necessarily what they should.  In other words, the investors may be selling gold to raise funds because it is a liquid asset.

Returning to the gold model chart, we highlighted the area in yellow that represents the 2008 Great Financial Crisis.  In the worst of that situation, gold also underperformed fair value.  However, once the liquidating stopped, gold began a multi-year bull market.  Although we are not necessarily expecting a similar move in prices, we do expect the aggressive expansion of liquidity via fiscal and monetary policy to create favorable conditions for gold in the coming years.

View the PDF