

Business Cycle Report (July 23, 2020)
by Thomas Wash | PDF
The business cycle has a major impact on financial markets; recessions usually accompany bear markets in equities. The intention of this report is to keep our readers apprised of the potential for recession, updated on a monthly basis. Although it isn’t the final word on our views about recession, it is part of our process in signaling the potential for a downturn.
In June, the diffusion index stayed in recession territory as improvements in several indicators could not outweigh the negative impact of the previous three months. That being said, it does appear that the worst is now behind us. Financial markets continued to show signs of improvement as Fed Chair Jerome Powell testified before Congress that the Fed will not remove stimulus prematurely. Additionally, fiscal stimulus and monetary easing led to a sharp rise in equities. Meanwhile, the labor market showed signs of improvement as an increase in consumption, following the reduction in lockdown restrictions, allowed firms to hire workers in record numbers. However, economic uncertainty has weighed on consumer and investor confidence as a rise in virus cases toward the end of the month has hindered efforts to further ease restrictions. As a result, six out of the 11 indicators are in contraction territory. The reading for June remains unchanged from the previous month, at -0.1515, well below the recession signal of +0.250.
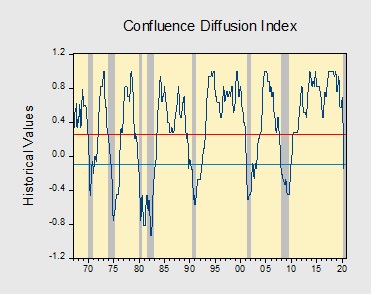
The chart above shows the Confluence Diffusion Index. It uses a three-month moving average of 11 leading indicators to track the state of the business cycle. The red line signals when the business cycle is headed toward a contraction, while the blue line signals when the business cycle is headed toward a recovery. On average, the diffusion index is currently providing about six months of lead time for a contraction and five months of lead time for a recovery. Continue reading for a more in-depth understanding of how the indicators are performing and refer to our Glossary of Charts at the back of this report for a description of each chart and what it measures. A chart title listed in red indicates that indicator is signaling recession.