

Asset Allocation Weekly (July 24, 2020)
by Asset Allocation Committee | PDF
In the Federal Reserve’s 107-year history, it has used a number of different methods to manage monetary policy. In its early years, it relied on the discount rate and reserve requirement adjustments as policy tools. During WWII, it managed the yield curve to a specific interest rate to support Treasury borrowing to fund the war effort. In the early 1950s, monetary policy became independent of government borrowing. From this period into the late 1970s, the Fed managed monetary policy by setting a target rate for fed funds. Chair Volcker moved to target the money supply in a bid to bring down inflation; monetary targeting ended by 1987. From 1987 until 2008, the primary tool of monetary policy was the fed funds policy rate. If the banking system was oversupplied with reserves, the fed funds rate would decline below target. The Fed would engage in open market operations to reduce the level of reserves to lift the effective fed funds rate. Under conditions of an undersupplied market, banks would be bidding up rates to acquire reserves; the Fed would inject money into the banking system to prevent the effective fed funds rate from overshooting the target rate. During the Great Financial Crisis, the U.S. central bank flooded the banking system with reserves to ensure ample liquidity; this action led to a massive level of bank reserves rendering the traditional fed funds rate management impossible. The level of reserves would have anchored the fed funds rate at zero. To allow for rate flexibility, the Fed began paying interest on reserves.
In March, when the pandemic triggered financial stress, the FOMC responded quickly. Not only were rates cut but the Fed announced a series of actions designed to provide liquidity to various parts of the financial system. In an unprecedented step, the central bank bought corporate bonds, including some that were below investment grade. It purchased municipal bonds. It also offered broad support for money markets and commercial paper. And, it increased and broadened swap lines with foreign central banks to provide global dollar liquidity. All these actions led to a massive rise in the Fed’s balance sheet.
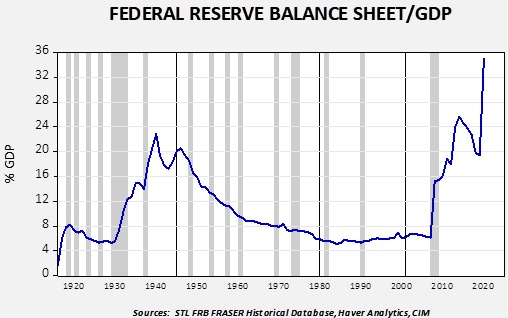
This chart shows the Federal Reserve’s balance sheet relative to nominal GDP. Note that the current level of the balance sheet is at all-time highs.
Recently, the Fed’s balance sheet has contracted; this change has raised concerns that the central bank may be withdrawing stimulus which would be bearish for the economy and financial markets.
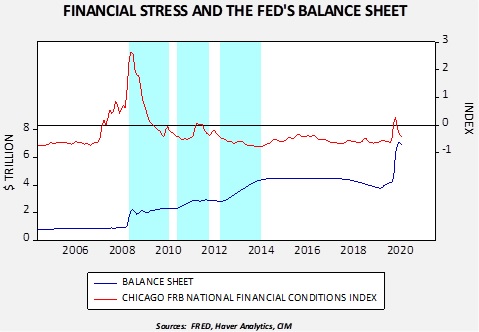
This fear is misplaced, but understandable. This chart shows the balance sheet along with the Chicago FRB’s National Financial Conditions Index. A rising index number indicates increasing financial system stress. We have shaded three periods of quantitative easing. It is notable that the first two cycles had specific levels of asset purchases. In other words, a given level of buying and a definitive end date was established. The third cycle was more open ended in time but initially fixed in terms of purchases.
The recent rise in the balance sheet is less about supporting the economy and more about suppressing financial stress. And so, as the level of stress has declined, the demand for Fed support has as well, leading to a decline in the balance sheet. This isn’t due to the Fed withdrawing support; it is, in fact, evidence of the Fed’s success. It should be noted, however, that the facilities remain in place. If stress rises, the Fed has policies in place to suppress it.
The central bank’s next step will likely be to add accommodation. In other words, additional actions will likely be necessary to encourage economic recovery. Potential policies might entail yield curve control, “QE for people,” or direct payment from the Fed to households. The important point is that one should not mistake the recent decline in the balance sheet as a sign of tightening.