

Author: Rebekah Stovall
Asset Allocation Weekly (September 4, 2020)
by Asset Allocation Committee | PDF
(NB: Due to the Labor Day holiday, the next report will be published on September 18.)
The U.S. economy is driven primarily by consumer spending. In 2019, for example, personal consumption expenditures on goods and services accounted for 67.9% of U.S. gross domestic product (GDP). For the economy to grow, consumers simply must boost their spending. But what allows consumers to do that? Generally, consumers need to fund their spending out of income, so one key to sustained growth in consumer spending is sustained growth in consumers’ income. The Commerce Department tracks the total volume of personal income in the economy, including wages and salaries (the large majority of income). It also counts proprietors’ income, dividends, interest, rent, and the like.
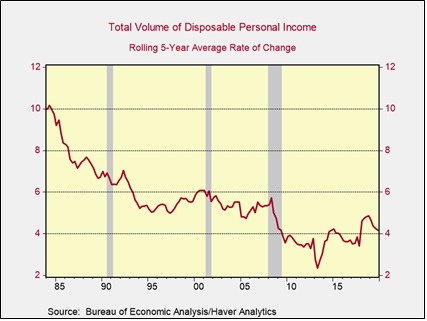
The problem is not all that income is available to be spent. As the saying goes, there is nothing certain in life but death and taxes. Since one can’t easily avoid paying the government’s take, economists typically focus on personal income after taxes, commonly referred to as “disposable income.” The graph below shows how the total volume of disposable income has grown at a slower and slower rate for most of the time since the mid-1980s. The slowdown reflects many factors, such as slower population growth, globalization, declining inflation, and changing tax policy. The slowdown in disposable income growth goes far toward explaining why U.S. economic growth has moderated over the last few decades.
We think it’s also useful to dive a bit deeper into the personal income story. Note, for example, that once a person takes on debt, they have an obligation to make debt service, i.e., interest and principal payments. That debt service might not be as hard to avoid as taxes but getting out of the obligation is onerous. Debt service limits how much discretion people really have over their spending, so we pay close attention to a measure that we think is a better gauge of truly discretionary income. Our measure consists of disposable income less debt service (in other words, total personal income after paying taxes, interest, and principal). To better approximate how discretionary income has grown from the perspective of an individual, we calculate it on a per-capita basis. In the chart below, the red line shows the rolling five-year rate of change in per-capita discretionary income based on our calculations.
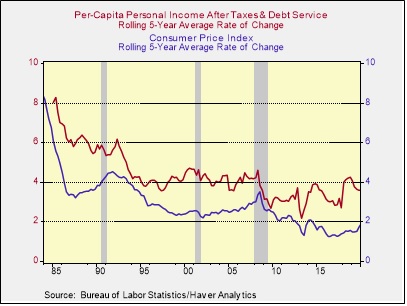
Rising prices can take a bite out of people’s purchasing power, so we also compare how our measure of income has changed versus the consumer price index (CPI), which is shown by the blue line in the chart. Over the period shown in the chart, per-capita discretionary income has grown by an average of 1.56% over the rate of inflation. When the gap narrows—because of slowing income growth, accelerating inflation, or both—recessions often follow. More broadly, the big story here is that since the late 1980s, when per-capita discretionary income was growing almost 3% faster than consumer prices, income growth has generally exceeded inflation by a much narrower margin. Much of the reason was the dramatic rise in household debt and debt service as consumers struggled to maintain their lifestyles during the 1990s and early 2000s. In the midst of the Great Financial Crisis of 2008-2009, consumers were saddled with all the mortgage debt they took on during the housing boom, so the growth in per-capita discretionary income barely exceeded inflation at all. The disparity remained weak in the years immediately following the crisis until consumers were able to work down their debt.
The good news is that discretionary income accelerated far beyond inflation in the late 2010s. In the five years ended in December 2018, per-capita discretionary income grew at a rate 2.69% higher than CPI inflation, almost matching the best figure in the late 1980s and reflecting improved wage and salary growth, falling debt service costs, tax cuts, and stagnating population growth. Consumer finances looked very good before the coronavirus hit. Now, however, the pandemic is seriously pushing down income, and many people may take on increased debt to tide them over. That means that even if prices fall a bit more or remain stable, the disparity of discretionary income over inflation could weaken again and discourage spending growth.
Weekly Energy Update (September 3, 2020)
by Bill O’Grady, Thomas Wash, and Patrick Fearon-Hernandez, CFA | PDF
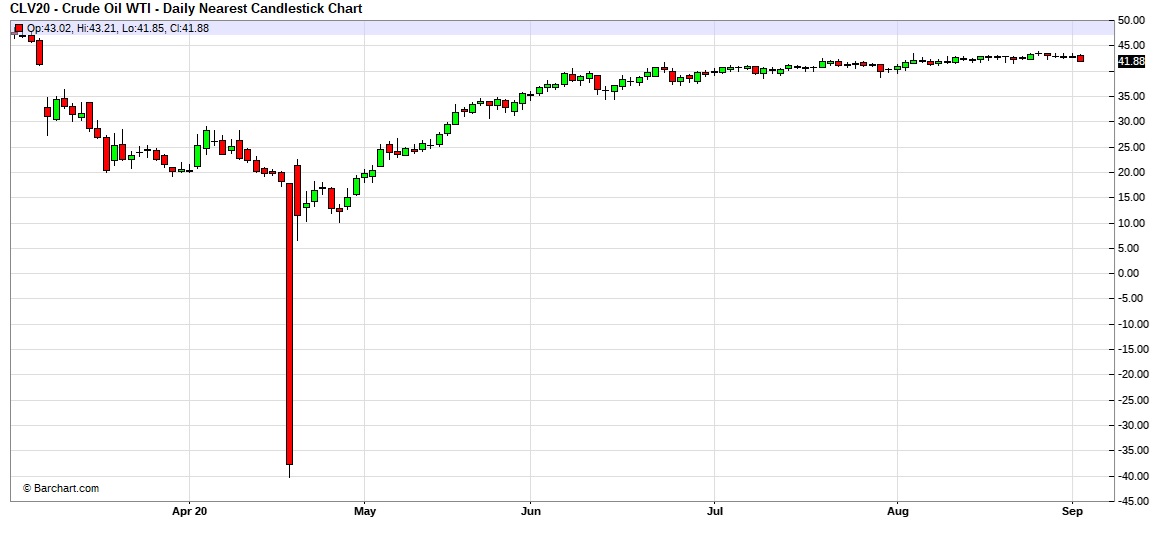
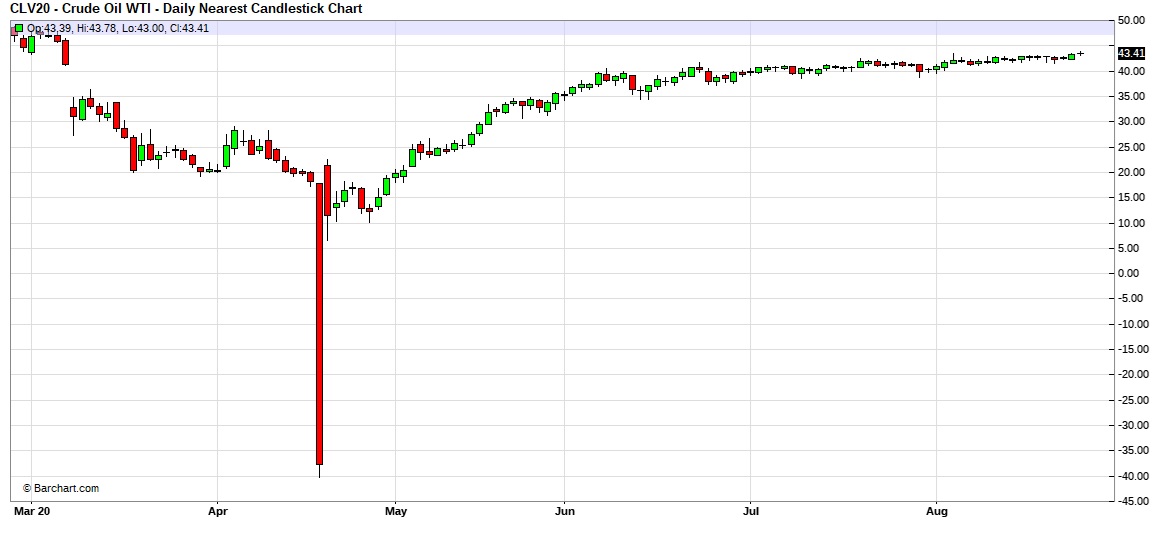
Here is an updated crude oil price chart. The oil market has stabilized at higher levels after April’s historic collapse.
Crude oil inventories fell more than anticipated, declining 9.4 mb compared to forecasts of a 2.0 mb decline. The SPR declined 1.3 mb; since peaking at 656.1 mb in July, the SPR has drawn 7.9 mb. Given levels in April, we expect that another 13.2 mb will be withdrawn as this oil was placed in the SPR for temporary storage. Taking the SPR into account, storage dropped 10.7 mb.

In the details, U.S. crude oil production fell 1.1 mbpd to 9.7 mbpd. Exports fell 0.4 mbpd, while imports declined 1.0 mbpd. Refining activity fell 5.7%.
The data this week was affected by Hurricane Laura. Usually, the energy trade is disrupted when a large hurricane enters the Gulf of Mexico. Although oil exports and imports fell, the latter’s decline was much larger, supporting the decline in inventory levels. This drop occurred despite a sharp decline in refining activity. We expect the refiners that closed for precautionary reasons will reopen soon whereas those who suffered damage will be down for longer. Imports should resume in next week’s report and a rise in stockpiles is likely.
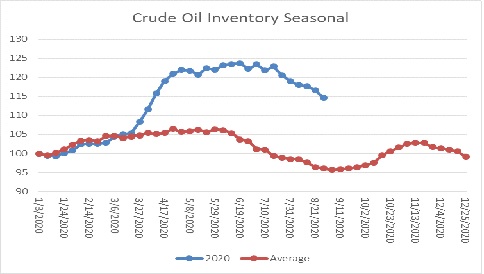
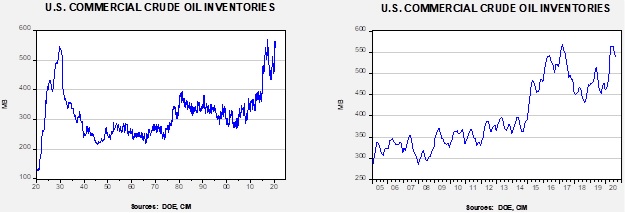
The above chart shows the annual seasonal pattern for crude oil inventories. This week’s data showed another decline in crude oil stockpiles. We are approaching the end of the seasonal withdrawal period. Although the declines of the last few weeks are supportive, stockpiles remain well above seasonal norms and remain a bearish factor.
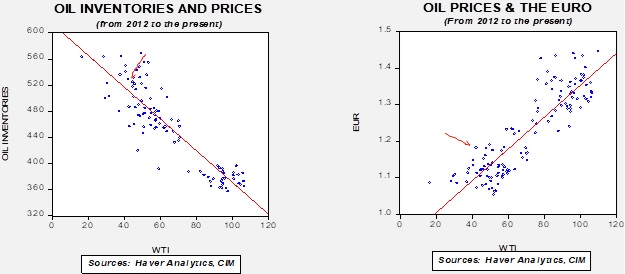
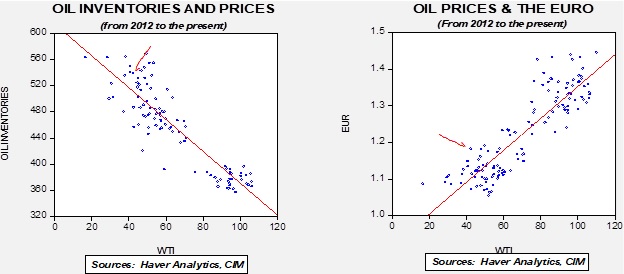
Based on our oil inventory/price model, fair value is $41.00; using the euro/price model, fair value is $64.26. The combined model, a broader analysis of the oil price, generates a fair value of $52.74. The wide divergence continues between the EUR and oil inventory models. As the trend in the dollar rolls over, it is bullish for crude oil. Any supportive news on reducing the inventory overhang could be very bullish for crude oil.
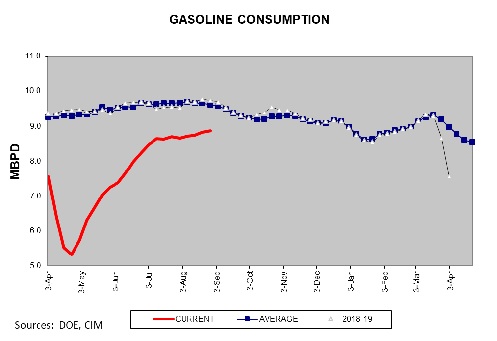
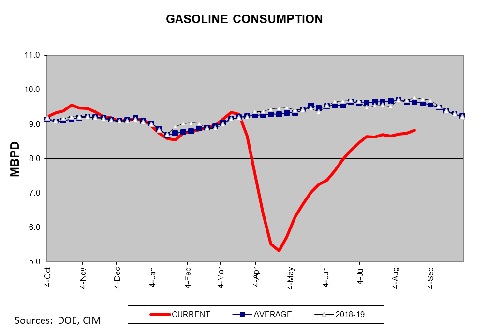
Gasoline consumption has started to edge higher. Although we probably won’t see the usual seasonal decline in consumption (there wasn’t much of a vacation season), the improvement we are seeing is consistent with a slow recovery of the economy.
In oil news, reflecting the above chart, data from Upwork shows there has been a significant decline in commuting due to the pandemic. The report suggests that some 890 MM fewer miles per day are being traveled.
Nuclear power has suffered from adverse public relations for years. Although it may be the greenest of electric power (it generates no CO2), the waste product is a problem. But, the tragedy of Chernobyl and the near miss of Three Mile Island undermined public confidence. And so, we note with great interest plans to produce small, self-contained nuclear reactors. In theory, these could be stacked to become larger reactors. It isn’t clear if these new reactors will solve the problem of nuclear waste, but these developments could lead to a new path for this power source.
View PDF
Weekly Geopolitical Report – Trump’s Foreign Policy in a Second Term (August 31, 2020)
by Patrick Fearon-Hernandez, CFA | PDF
(As is our custom, we will take a break for the Labor Day holiday. The next report will be published on September 7, 2020.)
In our WGR last week, we examined how U.S. foreign policy might look in the event that Democratic Party nominee Joe Biden wins the November presidential election. But, of course, the race remains competitive, and there is plenty of time for things to swing either way. In our report this week, we examine how foreign policy might look if President Trump wins a second term.
It’s tempting to think a second term would be a mere continuation of Trump’s first four years. In reality, it could differ significantly. Presidents in their second terms often rely on different advisors than they did when they first came to power. They’re also lame ducks from their reelection onward, so they have less power. On the other hand, since they no longer need to worry about the next election, they can feel less constrained and anxious to build their legacy. The result could be a noticeably different foreign policy from 2021 to 2025, with important ramifications for investors.
Asset Allocation Weekly – #9 (Posted 8/28/20)
Asset Allocation Weekly (August 28, 2020)
by Asset Allocation Committee | PDF
As people think about the supplemental federal unemployment benefit of $600 per week that was in place through July, most would assume that if the total benefits exceed a person’s actual wages, they will choose to be unemployed instead of accepting employment. Anecdotal reports suggest that companies are running into this problem. In fact, Dallas FRB President Robert Kaplan, in an interview with Bloomberg’s Mike McKee, noted that he was hearing of this problem from his business contacts in the 11th Federal Reserve District. However, he also noted that there was little evidence in the data of this phenomena. So, why isn’t this seen in the data? The answer may have something to do with a person’s economic outlook.
Accepting unemployment benefits, even with the added booster, may be a costlier choice than most people realize. Because employment benefits are temporary, people must weigh whether it is in their best interest to accept benefits with the opportunity cost of giving up work tenure and experience, even at lower compensation compared to not working. During an expansion, it might make sense to accept benefits, especially if it comes with a booster, as people would have an easier time finding work once the entitlements run out. However, the same is not true when an economy is in recession.
In a recession, having a job provides workers a relatively reliable and potentially long-lasting source of income during a time of uncertainty. Unemployment benefits, particularly with the added booster, are not only temporary but are also subject to change. Hence, workers may be less receptive to generous benefits if they suspect that a job won’t be available when they need it. This dilemma may partially explain why many economists failed to find conclusive evidence in the data to suggest that getting rid of the added benefits would lead to lower unemployment.[1], [2]
Our own research found evidence to suggest that the opposite may be true. Looking at the top 10 states by the number of continuing claims, we found that unemployment benefits and the unemployment rate were inversely correlated. Thus, the more generous the benefits, the lower the unemployment rate. One possible explanation for this inverse relationship may be due to the fact that people who live in or near a megalopolis are more confident in finding new opportunities than people who don’t, hence people living in those areas are more likely to accept the benefit.
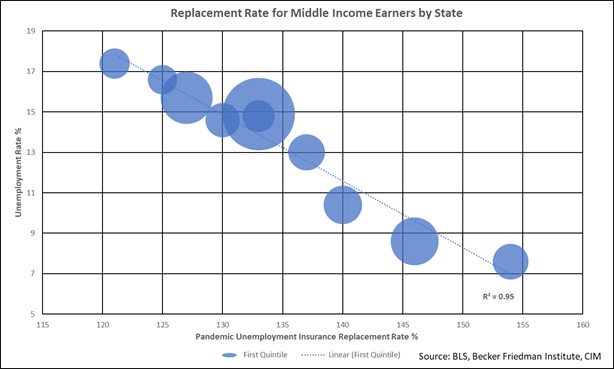
The chart above shows the unemployment rate and the pandemic unemployment insurance replacement rate by state.[3] The bubble size represents the amount of people receiving unemployment benefits. Eight of these 10 states, listed on the above graph, are the highest in population and the two that are not, New Jersey and Massachusetts, are near major population centers. It is possible that employment opportunities are better in these larger states.
In no way are we arguing that higher unemployment benefits will lead to lower unemployment. In fact, the full chart,[4] which includes all 50 states, clearly shows that the unemployment rate and the replacement rate are uncorrelated. However, this chart may be a reflection of workers’ unwillingness to turn down a job today when there is no guarantee that there will be a job in the future.
This thesis is further supported by the jobs report. From May through July, the industries offering the lowest average weekly wage saw the biggest expansion in their respective payrolls. In fact, the two lowest-paying industries, “leisure and hospitality” and “retail trade,” accounted for nearly 60% of the jobs created in that time frame. Therefore, wages clearly aren’t being prioritized for those choosing to return to work.
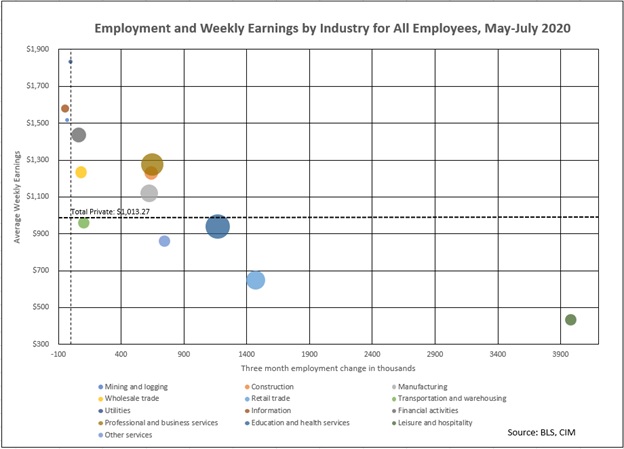
The chart above shows the average weekly earnings and the three-month change in employment by industry. The size of the bubble represents the employment level. With the exception of transportation and warehousing, every industry in which average weekly earnings were below the national average added more jobs than the industries in which average weekly earnings were above the national average.
We are clearly in the midst of an anomalous event. As a result, things may not always be as they appear. If we were to push both charts to their logical conclusions, it would suggest that the key to bringing down the unemployment rate would be for the government to raise unemployment benefits to infinity and for employers to reduce wages to zero. That conclusion would clearly be absurd. That being said, it does suggest that lawmakers and policymakers alike should be cautious when deciding whether to scale back stimulus as it will likely have unknown and unintended consequences. Under normal circumstances, when jobs are easy to get, taking a break to collect outsized unemployment benefits might be an attractive option. But, if jobs are scarce, there is a risk to not returning to a job. Anecdotal evidence is true as far as it goes, but may not be generalizable, so policymakers should exercise care in shaping policy based on “what they are hearing.” The consensus among economists is that the supplemental benefit likely does more good than harm as it contributes to consumption spending.[5] In summary, the costs of the higher supplement to unemployment insurance may be lower than generally believed in terms of discouraging employment, and it may have an outsized impact on consumption if it is reduced.
[1] https://tobin.yale.edu/sites/default/files/files/C-19%20Articles/CARES-UI_identification_vF(1).pdf
[2] https://www.wsj.com/articles/economists-vs-common-sense-11596398926
[3] The pandemic unemployment insurance replacement rate is calculated by dividing the amount of insurance employment benefits plus the booster divided by the average weekly rate by state.
[4] Included in this week’s AAW chart book.
[5] https://www.wsj.com/articles/wsj-survey-benefits-of-extra-unemployment-aid-outweigh-work-disincentive-11597327200?st=y030ojqt1zyug3h
Business Cycle Report (August 27, 2020)
by Thomas Wash | PDF
The business cycle has a major impact on financial markets; recessions usually accompany bear markets in equities. The intention of this report is to keep our readers apprised of the potential for recession, updated on a monthly basis. Although it isn’t the final word on our views about recession, it is part of our process in signaling the potential for a downturn.
In July, the diffusion index surged into recovery territory signaling that the economy may be on track to grow in Q3. Financial markets were sending mixed signals as equities surged while the yield curve flattened. Meanwhile, the labor market showed signs of improvement as firms hired workers in record numbers. Firms were likely optimistic about the economy as the month saw an increase in consumption resulting from the reduction in lockdown restrictions. However, economic uncertainty has weighed on consumer and investor confidence as a rise in virus cases has hindered efforts to further ease restrictions. As a result, five out of the 11 indicators are in contraction territory. The reading for July rose from -0.1515 to -0.0303, above the recovery signal of -0.100.
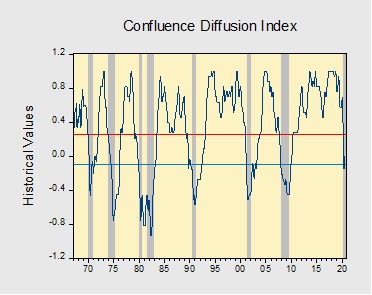
The chart above shows the Confluence Diffusion Index. It uses a three-month moving average of 11 leading indicators to track the state of the business cycle. The red line signals when the business cycle is headed toward a contraction, while the blue line signals when the business cycle is headed toward a recovery. On average, the diffusion index is currently providing about six months of lead time for a contraction and five months of lead time for a recovery. Continue reading for a more in-depth understanding of how the indicators are performing and refer to our Glossary of Charts at the back of this report for a description of each chart and what it measures. A chart title listed in red indicates that indicator is signaling recession.
Weekly Energy Update (August 27, 2020)
by Bill O’Grady, Thomas Wash, and Patrick Fearon-Hernandez, CFA | PDF
Here is an updated crude oil price chart. The oil market has stabilized at higher levels after April’s historic collapse.
Crude oil inventories fell more than anticipated, declining 4.7 mb compared to forecasts of a 3.0 mb decline. The SPR declined 1.8 mb; since peaking at 656.1 mb in July, the SPR has drawn 6.6 mb. Given levels in April, we expect that another 14.5 mb will be withdrawn as this oil was placed in the SPR for temporary storage. Taking the SPR into account, storage dropped 6.5 mb.
In the details, U.S. crude oil production rose 0.1 mbpd to 10.8 mbpd. Exports jumped 1.2 mbpd, while imports rose 0.2 mbpd. Refining activity rose 1.1%.

The above chart shows the annual seasonal pattern for crude oil inventories. This week’s data showed another decline in crude oil stockpiles. We are approaching the end of the seasonal withdrawal period. Although the declines of the last few weeks are supportive, stockpiles remain well above seasonal norms and remain a bearish factor.
Next week’s data, and data for the next few weeks, will likely be affected by Hurricane Laura. The storm will disrupt refinery operations and seaborne trade for the next few weeks. In 2005, the combination of Hurricanes Katrina and Rita took refinery operations from 95% to just below 70%. Although we don’t expect a repeat of that situation, we will see a drop in refinery operations. Currently, the nation is well stocked with crude oil and distillates (diesel). A bit worrisome is that gasoline stockpiles are less ample, although demand remains low enough that we don’t expect a sustained jump in prices due to the hurricane.
Based on our oil inventory/price model, fair value is $37.99; using the euro/price model, fair value is $64.09. The combined model, a broader analysis of the oil price, generates a fair value of $51.16. The wide divergence continues between the EUR and oil inventory models. As the trend in the dollar rolls over, it is bullish for crude oil. Any supportive news on reducing the inventory overhang could be very bullish for crude oil.
Gasoline consumption has started to edge higher. Although we probably won’t see the usual seasonal decline in consumption (there wasn’t much of a vacation season), the improvement we are seeing is consistent with a better economy.
In oil news, Kuwait and the Kingdom of Saudi Arabia (KSA), with the support of the U.S., are looking to link the power grid of these Gulf States to Iraq. Baghdad has mostly fallen under the sway of Iran since most U.S. forces have left Iraq, but the dominance isn’t complete. The hope is that if Iraq’s economy is tied more closely to the Arab states, Iranian influence can be weakened.
Massive public investment projects continue in the KSA despite weak oil prices. It is clear that CP Salman is moving quickly to diversify the Saudi economy away from oil and believes these megaprojects are the path to foster this goal. Although we do agree that we are probably now past the era of peak oil (the removal of Exxon (XOM, 40.03) from the Dow Jones is a symbol of this trend), we are not sure that these projects will give the KSA the ability to diversify from oil. At the same time, the existence and high priority of these projects indicate Riyadh does see that its current economic structure won’t last indefinitely.
The UN Security Council has rejected a U.S. bid to “snapback” suspended sanctions on Iran for violating the terms of the Iran nuclear deal. After pulling out of the arrangement and implementing unilateral sanctions on Iran, the U.S. wanted to reinstate the international ones that existed before the deal was made in 2015. Although American sanctions are potent, they lack the international credibility of the UN imprimatur, and thus the odds are increased that other nations may violate American sanctions.
Economists have argued for some time that the most efficient way to reduce hydrocarbon consumption is with a carbon tax. Creating a price for carbon gives signals to consumers and producers that support changes in behavior. California is the only U.S. state with a modified version of a carbon tax (it uses a “cap and trade” model that is similar to a tax), where preserving forests, which pull carbon dioxide out of the atmosphere, can offset carbon production in other parts of the economy. This gives trees an economic value other than for tourism and lumber.