

Weekly Energy Update (October 29, 2020)
by Bill O’Grady, Thomas Wash, and Patrick Fearon-Hernandez, CFA | PDF
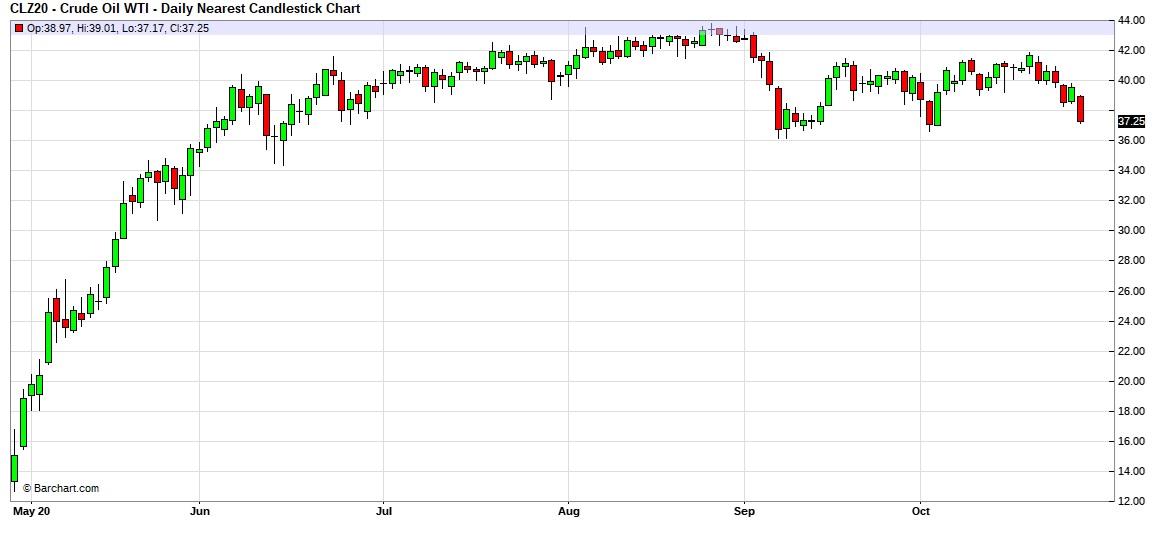
Here is an updated crude oil price chart. Prices remain rangebound but are testing the lower boundary of the range.
Commercial crude oil inventories rose 4.3 mb when a 1.5 mb build was expected. The SPR declined 0.7 mb; since peaking at 656.1 mb in July, the SPR has drawn 17.2 mb. Given levels in April, we expect that another 4.4 mb will be withdrawn as this oil was placed in the SPR for temporary storage. Taking the SPR into account, storage rose 3.7 mb.
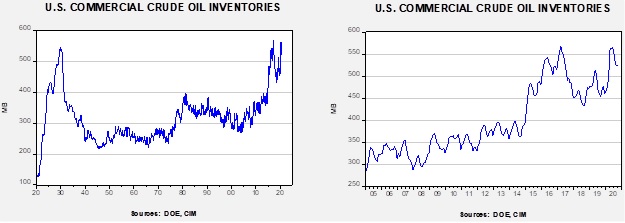
In the details, U.S. crude oil production rose 1.2 mbpd to 11.0 mbpd. Exports rose 0.4 mbpd, while imports also increased 0.5 mbpd. Refining activity rose 1.7%. The data suggest a return to normal after a few weeks of hurricane disruptions, although we are dealing with another this week, Hurricane Zeta. The hurricane season traditionally ends on Halloween and Zeta doesn’t appear to be strong enough to cause a significant decline in production. Thus, we should be close to finished with the effects of tropical activity.
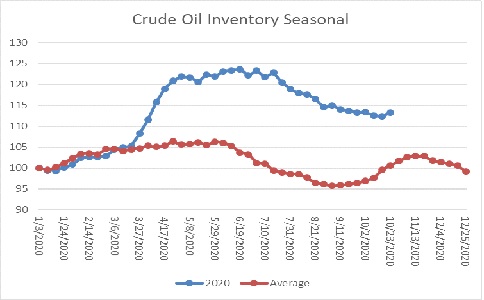
The above chart shows the annual seasonal pattern for crude oil inventories. This week’s data showed a build in crude oil stockpiles, which is the normal seasonal pattern. Inventories tend to make their second seasonal peak about mid-November. We are approaching the period where inventories tend to decline into year’s end.
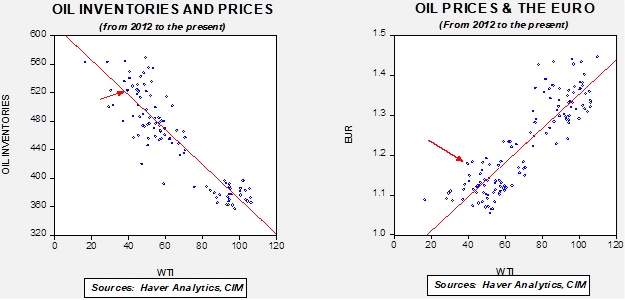
Based on our oil inventory/price model, fair value is $42.84; using the euro/price model, fair value is $62.70. The combined model, a broader analysis of the oil price, generates a fair value of $51.92. The wide divergence continues between the EUR and oil inventory models. However, current oil prices are below all three measures of fair value, suggesting that oil prices are likely undervalued.
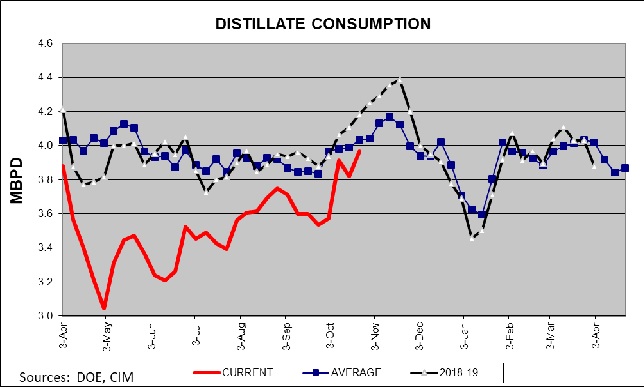
Last week, we noted that distillate inventories had declined. They did so again this week. But what caught our attention this week has been the recovery in distillate demand. This rise may be more due to home heating inventory building, but it may also be a “ground level” indication that the economy is improving. Consumption is near the five-year average.
Oil prices have been under pressure recently due to the return of Libyan production. Weak global oil demand has made prices especially sensitive to supply news. Russia, in light of these concerns, has indicated it plans on delaying an expected OPEC+ production increase. Meanwhile, on the geopolitical front, Iraq is facing increasing scrutiny for facilitating Iranian sanctions evasion. The U.S. has sanctioned the Iranian oil ministry and the state oil company along with other Iranian nationals.
With U.S. elections next week, political tensions are elevated. At the last debate, VP Biden suggested he supported moving away from oil production. This is part of the party’s platform, but it was surprising he would say it in a debate. In the short run, the comment won’t help in Texas or, more critically, Pennsylvania.
Natural gas prices have been rising since late July and have been holding steadily above $3.000 per MMBTU.
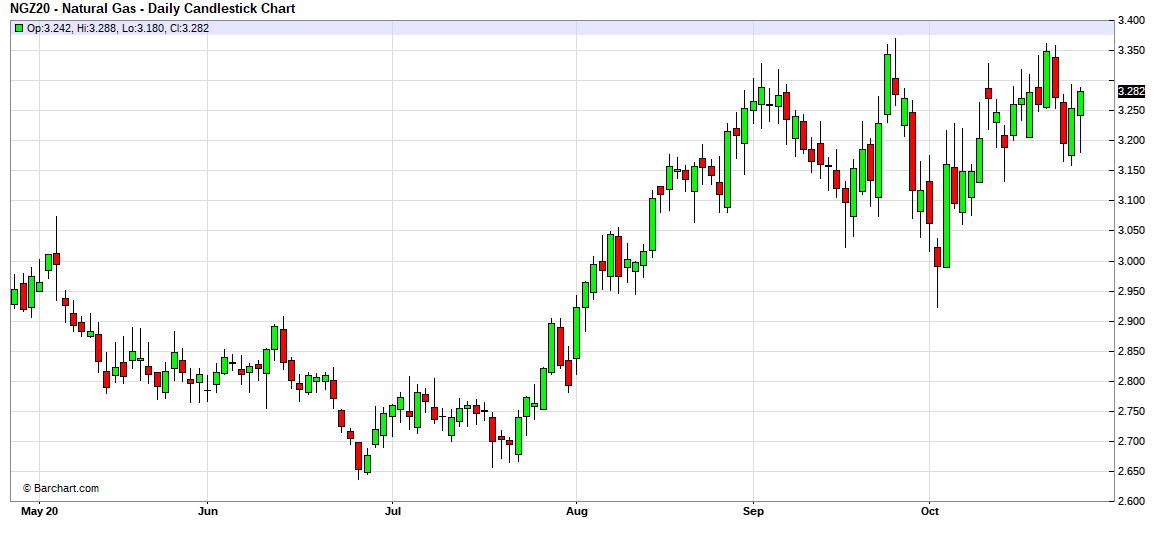
The bullish fundamental factor that is lifting prices is a decline in production.
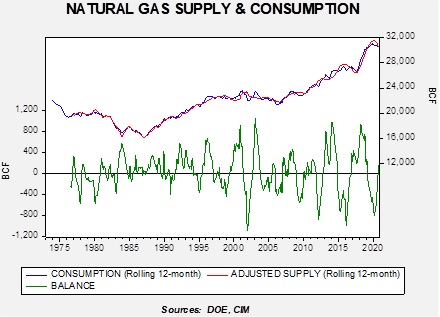
This chart shows the rolling 12-month level of supply (production + net imports) compared to the same measure for domestic consumption. Supply has been declining for two reasons; first, the sharp decline in oil prices has led to a drop in oil production that has reduced associated natural gas production that is part of the drilling process. Second, net imports are negative.
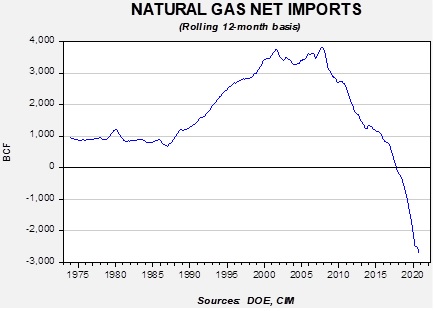
The expansion of LNG and pipeline sales to Mexico, along with a drop in gross imports, has led to the positive trade balance (negative net imports mean positive exports).
Unfortunately, inventory levels are elevated as we move into winter.
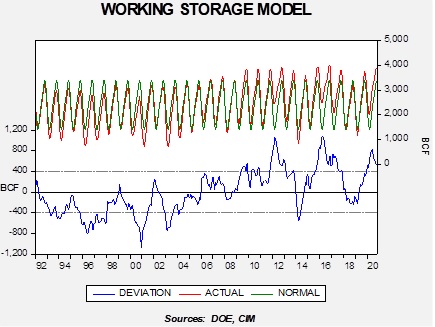
This model seasonally adjusts the level of inventories; when the lower line is above zero, storage levels are higher than normal.
If we combine the level of output, the balance between supply and consumption, and the level of inventories, fair value for natural gas is $2.14 per MMBTU. To justify current prices, inventory levels would need to decline by nearly 450 bcf on a seasonally adjusted basis. Since inventories are poised to decline on a seasonal basis starting in November, stockpiles must fall much faster than normal for prices to be maintained, implying winter demand will need to be robust. Given the winter forecast, that isn’t likely, so prices are vulnerable to a pullback into 2021.