by Bill O’Grady, Thomas Wash, and Patrick Fearon-Hernandez, CFA | PDF
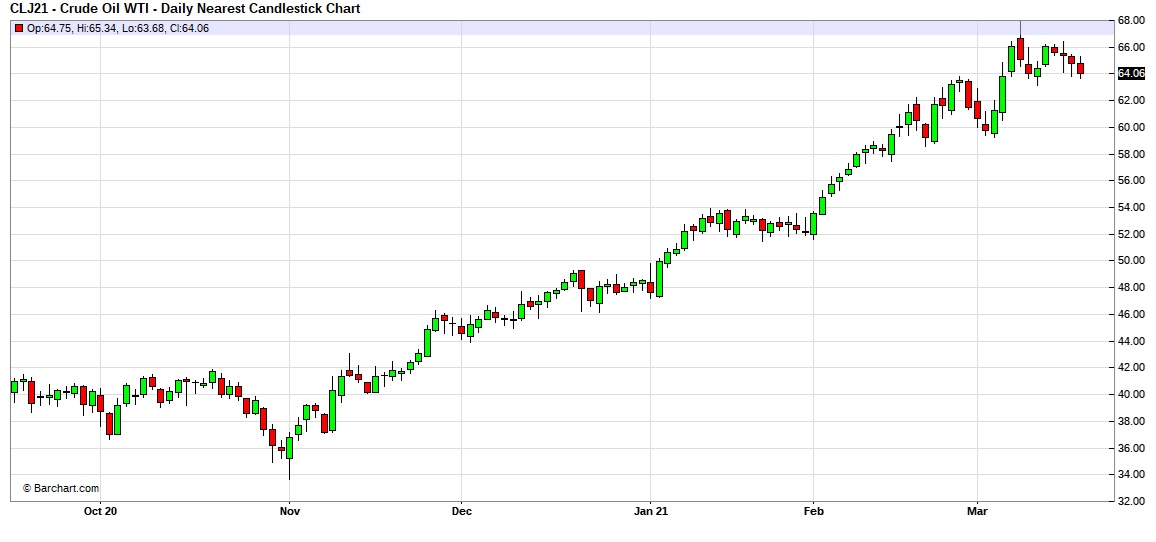
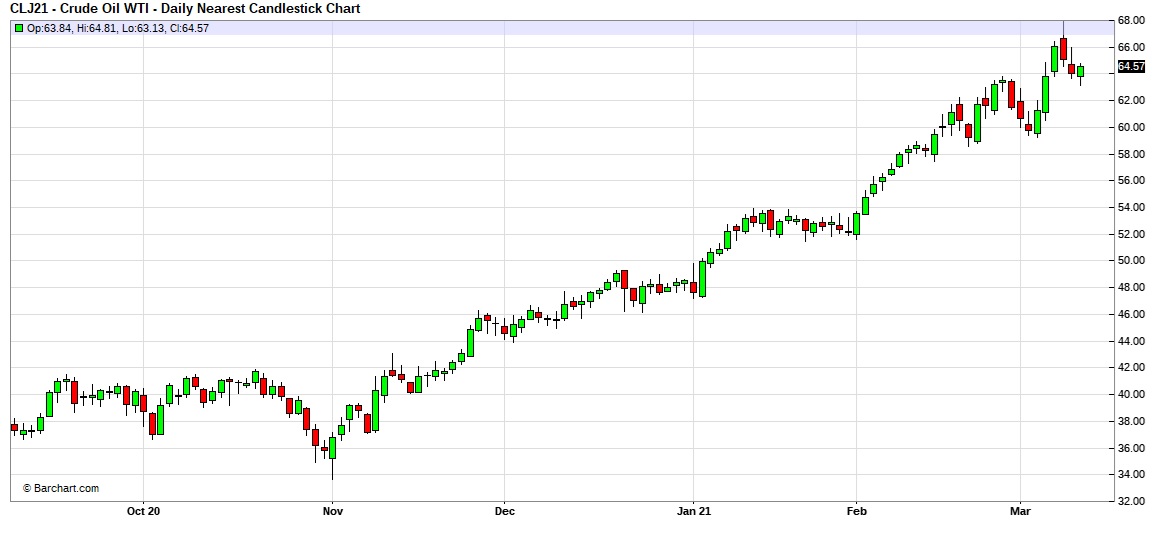
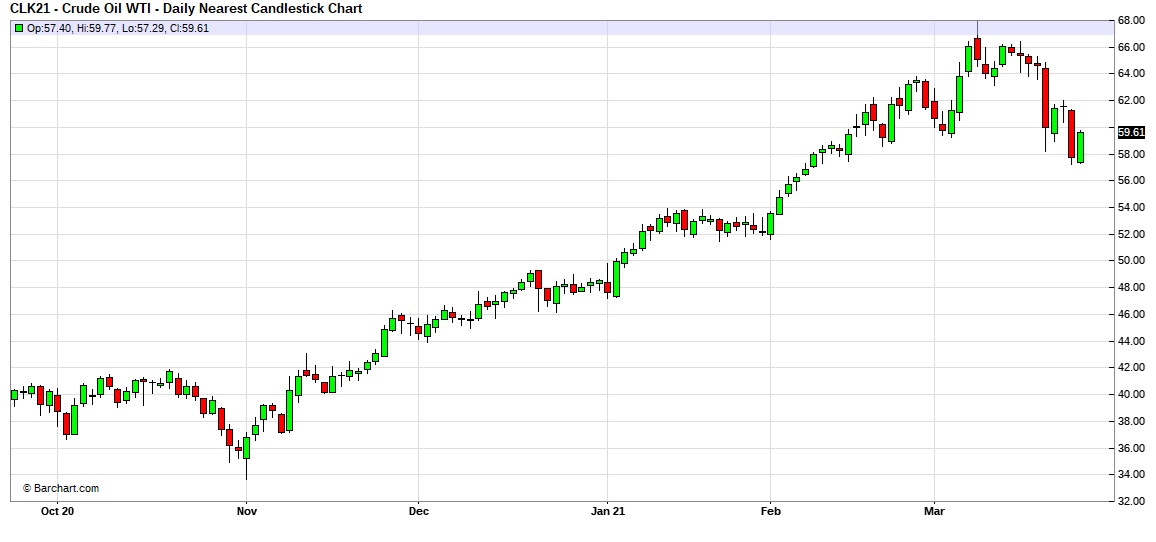
Here is an updated crude oil price chart. Prices have declined over $10 per barrel since peaking on March 8. Worries about slowing European growth and a slower than expected recovery in refinery operations after the Texas freeze have weighed on prices.
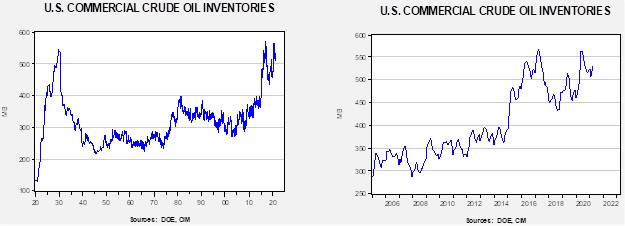
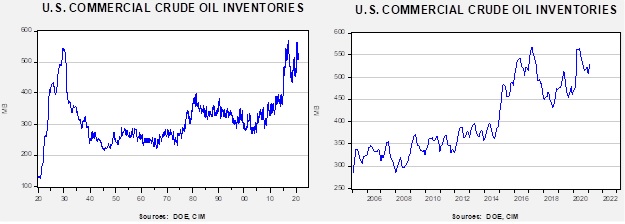
Crude oil inventories rose 1.9 mb compared to the 1.2 mb expected. There was no change in the SPR. Refinery operations, as noted below, continue to recover.
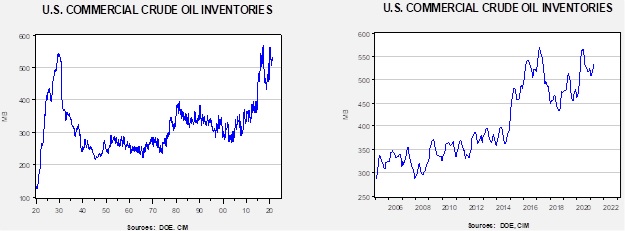
In the details, U.S. crude oil production rose 0.1 mbpd to 11.0 mbpd, meaning that U.S. production has recovered to pre-Texas disruption levels. Exports were unchanged, while imports rose 0.3 mbpd. Refining activity rose 5.5%.
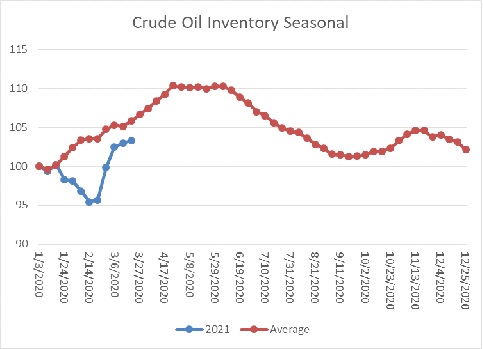
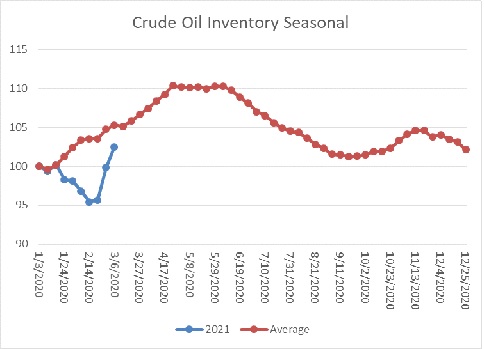
The above chart shows the annual seasonal pattern for crude oil inventories. Inventories remain at a seasonal deficit, but the gap did narrow, mostly due to disruptions surrounding the recent cold snap. If we were following the normal seasonal pattern, oil inventories would be 17.1 mb higher.
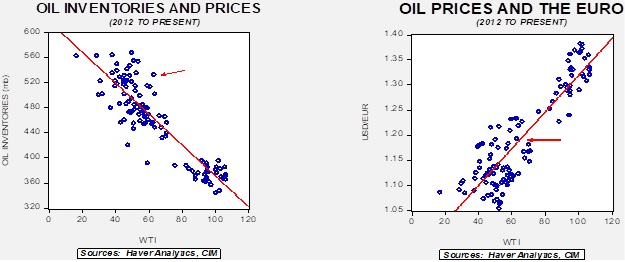
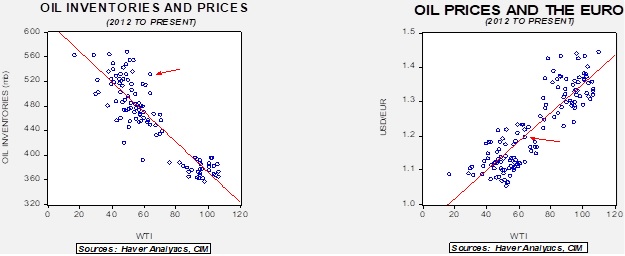
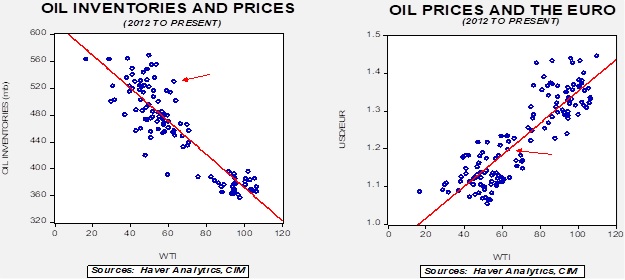
Based on our oil inventory/price model, fair value is $40.25; using the euro/price model, fair value is $65.54. The combined model, a broader analysis of the oil price, generates a fair value of $51.37. The divergence continues between the EUR and oil inventory models, although recent dollar strength has reduced the projected fair value generated from the euro/price model.
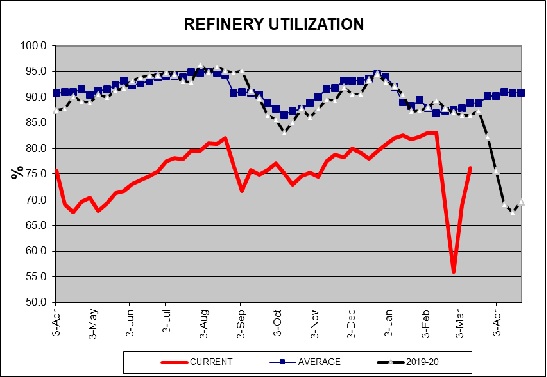
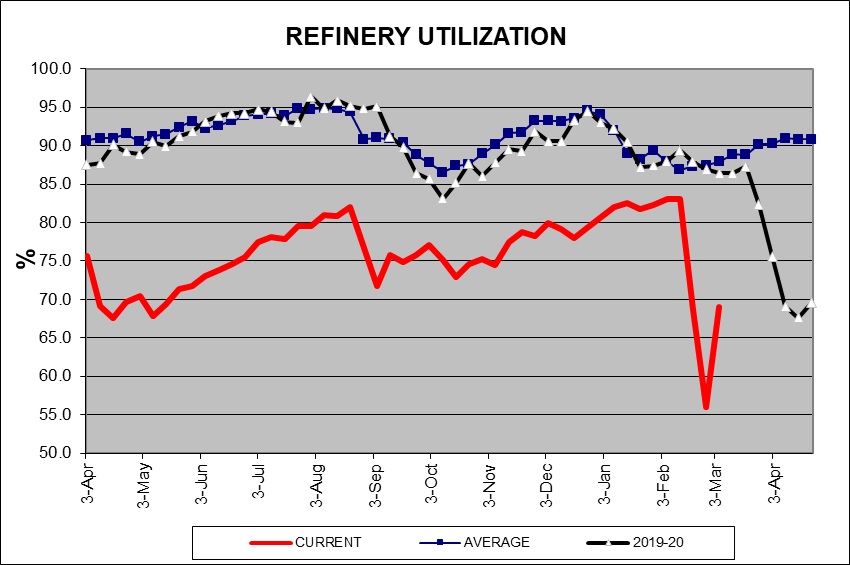
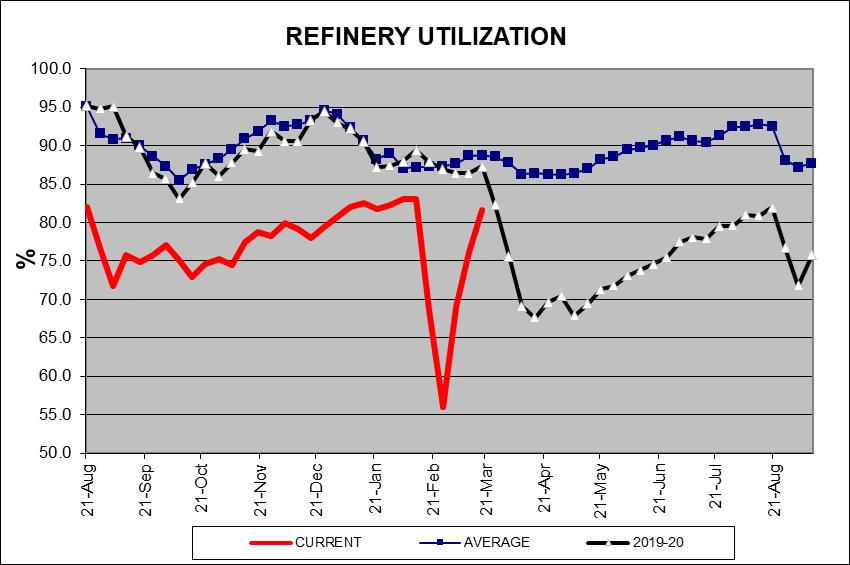
Refinery operations continued to recover last week and are near pre-winter storm levels. We would expect utilization to stabilize in the coming weeks.
Market news:
- Oil prices rallied after a large container ship blocked the Suez Canal. More than 100 ships are backed up at this critical shipping chokepoint. About 10% of world shipping traffic passes through the canal. The vessel ran aground in a sandstorm, which not only blocked visibility but made steering the ship difficult.
- Canadian Pacific Railway (CP, USD, 355.82) has agreed to buy Kansas City Southern (KSU, USD, 248.96) railroad. The concept behind the merger (which still needs regulatory approval) is to create a rail line from Mexico to Canada, effectively consolidating the USMCA trading bloc. A side effect of this merger could be that it allows Canadian tar sands oil to have another outlet to the U.S. via rail shipping. Pipelines have become increasingly difficult to build due to environmental regulations; we will be watching to see if these same groups try to block the merger.
- Companies that are considered risky credits have been able to issue new debt. This factor should reduce bankruptcies in the system and help maintain production. Although companies have been promising better output discipline, the combination of strong prices and available credit may lead to higher output.
- Despite banks making pledges to support the greening of the economy, they continue to make loans to fossil fuel companies. Globally, loans of $750 billion were made last year.
- The impact of the Texas freeze is slowly dissipating, but we are still seeing a notable impact on petrochemical markets.
- Saudi Aramco (2222, SAR, 34.90) announced it would maintain its dividend despite falling oil prices. The company had to borrow to meet this dividend. This factor suggests that the House of Saud continues to use the company as a source of funding and is not allowing it to act as a fully private, profit-seeking entity.
- As the U.S. increases vaccinations, we would expect that gasoline demand will continue to recover. Rising consumption, coupled with a slowly recovering refining sector, will likely lead to higher gasoline prices. This rise will likely be a political issue for the current administration. However, we do note that driving activity remains historically low, not just on a cyclical basis, but on a secular basis as well.
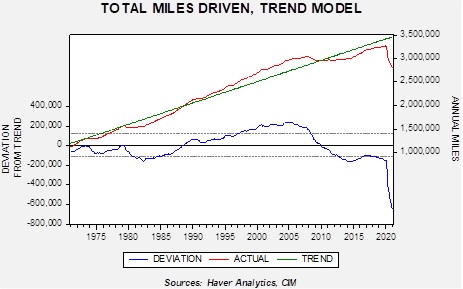
Driving activity fell below trend during the Great Financial Crisis and plummeted during the pandemic. It is highly unlikely we will ever return to trend. This factor will tend to dampen either gasoline prices or force the refining industry to contract. Recent IEA research supports this notion.
- The SEC is forcing energy companies to entertain investor votes on emissions targets. This factor will complicate company management.
Geopolitical news:
- A Biden administration goal was to return to the Obama-era nuclear deal. However, very little progress has been made. Iran wants the U.S. to roll back sanctions as a precondition for talks, while the U.S. wants Iran to cut back on nuclear activities as a precondition for talks. Given the history, neither side trusts the other. A complicating factor is that some parts of the 2015 agreement are coming to their negotiated end, meaning the return to the original deal doesn’t do much to address Iran’s threat to the region. Our take is that Obama wanted Iran to become the regional hegemon, allowing the U.S. to then shift its focus to Asia. Naturally, Israel and the Gulf States opposed this idea. However, the nuclear deal was a small step in the process; Obama likely accepted this because he assumed a Democrat would succeed him and carry out the rest of the process. This obviously didn’t occur. Now, the Biden administration likely has the same goal―exiting the Middle East―but doesn’t have an obvious path to that end.
-
- Despite this problem, left-wing populists (LWP) are getting agitated with the lack of progress. The LWP is concerned about the humanitarian impact of U.S. sanctions and wants to see this situation resolved.
- Iranian presidential elections will be held in June; the U.S. insists this isn’t a factor, but we fail to see how it wouldn’t affect negotiations.
- It is clear that sanctions have severely harmed the Iranian economy but have done little to move its leadership to talks. The longer sanctions are in place, the better Iran gets at undermining them.
- The Saudis have offered a ceasefire to Houthi rebels and a lifting of the blockade in a bid to start talks. So far, there has been little movement to end the conflict despite these offers.
- China is expanding its refining industry in a bid to dominate Asian product trade. This decision flies in the face of “greening” energy.
Alternative energy/policy news:
- An interesting area of battery research is in creating “massless” batteries. This isn’t a battery that has no mass but one that is part of the structure of the product. For example, if one could put the battery into the frame of a car, the battery would no longer be dead weight. Researchers claim they are making progress in this area; if true, it would open up new options for transportation, e.g., battery aircraft.
- India is considering a 2050 net-zero carbon goal. Given its current heavy use of coal for electricity, if met, it would be more negative news for coal. We note it would be a decade before China has promised to reach this level.
- Global oil company leaders are supporting a plan for pricing carbon. Without a carbon price, it will be difficult to use the market to allocate toward cleaner energy.
- After languishing for years, uranium prices are rising, boosting the prospects for uranium miners. If modular nuclear reactors become popular, the outlook would be even brighter.