Asset Allocation Weekly (August 12, 2016)

by Asset Allocation Committee

We originally published the comments below in our Daily Comment on July 27.  However, we have received a number of questions on the widening of the TED spread and the rise in LIBOR to warrant updating the report for this week’s Asset Allocation Weekly.

There has been some curious behavior in the LIBOR markets recently.  Although expectations of Fed tightening are benign, LIBOR rates have been ticking up.

(Source: Bloomberg)

This chart shows three-month USD LIBOR.  Note that over the past month, the rate has moved up around nearly 20 bps.  Usually, such moves occur for one of the following reasons: (a) the Fed is raising rates, or (b) there is a systematic financial system problem developing, leading investors to flee the LIBOR market for sovereigns.  The second case is one of the reasons for monitoring the TED (T-bills vs. Eurodollar) spreads.

The TED spread has been rising and is near levels seen during the last Eurozone crisis.  Although this increase warrants watching, putting the recent rise in context does suggest that this move, thus far, isn’t a signal of a major problem brewing.

(Source: Bloomberg)

Just compare the above chart to the long-term TED.

(Source: Bloomberg)

Note how LIBOR rates spiked in 2008 and were “spikey” from mid-2007 through 2008.  That is a more classic example of the flight to safety element of the TED spread.  We are not seeing that now.

So, why the rise in rates?  It’s entirely due to regulations on money market funds (MMFs).  On October 14, prime money market funds will see their statutory maximum weighted average maturity fall from 90 to 60 days.  In addition, institutional MMFs will be forced to institute a floating NAV and can put up “gates” to slow withdrawals during crises.  We are already seeing the impact.

Assets in prime MMFs have declined about $500 bn and government funds have risen by about the same amount since December.  Prime MMFs now represent 35% of total MMFs, down from 53% last October.  The total assets in MMFs are about the same but the allocation has shifted from prime to government MMFs, which don’t face the same restrictions.  We expect further shifts as investors begin to realize that a prime MMF isn’t “cash.”

Here are some potential market effects:

The dollar could rise.  The rise in USD LIBOR hasn’t been matched by a similar rise in EUR LIBOR.  All else held equal, the higher yield should support dollar buying.

Commercial paper markets will be adversely affected.  Prime MMFs buy commercial paper.  As funds shift to government funds, the money available to buy commercial paper will decline, boosting funding costs to commercial paper issuers.

A secular change in the TED spread is likely.  In general, investors discount the odds of a problem in the financial markets when they buy LIBOR-based paper.  With the rules on prime MMFs changing, the risk calculation will change, which should permanently shift the spread wider.  It is important for investors to realize that the TED isn’t necessarily signaling a financial system problem during this reset.

The rise in LIBOR and the dollar could be a bearish factor for commodities.  If the regulatory change acts as a de facto monetary policy tightening and isn’t offset by the Fed, we may see some weakness develop in commodities.  The primary driver of this will be the dollar.

Overall, investors will need to consult with their MMF providers and their financial advisors to determine which MMF is appropriate for them.  The issue really is what the function of the MMF is in the portfolio; if it is truly cash, then the government funds might be preferred.  If it is for yield, then one needs to realize that a prime MMF will likely lose its cash-like characteristics during financial crises and one could find that there will be a delay in tapping a prime MMF if financial conditions deteriorate.  Although retail investors in prime MMFs should not “break the buck,” that may not provide much comfort as the potential restrictions on withdrawals remain in place.

View the PDF

Daily Comment (August 12, 2016)

by Bill O’Grady and Kaisa Stucke

[Posted: 9:30 AM EDT] Eurozone economic growth came in on forecast, rising 1.6% annually.  While growth remains subdued, Q2 marked the 13th consecutive quarter of expansion.  German GDP came in better than expected, rising 3.1% annually compared to the 2.8% forecast.  At the same time, Italy’s growth disappointed, coming in below expectations (see below).  The chart below shows the Eurozone’s annual GDP growth.  The trend has been positive recently on strengthening consumption and robust trade numbers.  However, going forward, the uncertainty stemming from Brexit is expected to weigh on industrial production and exports.

The British pound has declined further over the past two weeks, reclaiming its position as the worst performing global currency in 2016 (yes, weaker year-to-date than the Argentine peso!).  The chart below shows the pound’s performance since the beginning of the year.  The currency plunged immediately following the Brexit vote and has continued to trend lower ever since, as the Bank of England restarted its stimulus program.

(Source: Bloomberg)

The chart below shows the GBP/USD exchange rate over the past three decades.  We have highlighted two major depreciations, the 1992 exit from the European Monetary System and the Great Financial Crisis.  Both events caused about a 30% decline in the currency.  So far, we are down 12.9% following the Brexit vote.  If history is any guide, the currency could trend lower from here.

(Source: Bloomberg)

View the complete PDF

Daily Comment (August 11, 2016)

by Bill O’Grady and Kaisa Stucke

[Posted: 9:30 AM EDT] European stocks advanced this morning alongside oil after the International Energy Agency (IEA) said it expects the global oil market to improve.  In its monthly report, the agency said it expects increasing refining to draw down the ample crude stockpiles, despite some large OPEC producers pumping oil at a record rate this summer.  However, the agency expects global production to decline to levels below demand as we head into autumn, which would eventually lead to a more balanced oil market.  The report comes a day after OPEC announced that the group’s largest producers had failed to agree on production cuts.  Production is unlikely to fall until this happens.  Additionally, the IEA’s projections rely on improving product demand, which is also seasonally unlikely as we exit the summer driving season.  Moreover, refining margins have declined over the past month and refiners are likely to wait for improving margins before their demand for crude picks up.  Thus, given the current circumstances, we would not expect short-term demand improvements.

Yesterday, the JOLTS report showed a rise in job openings in June.  Openings rose to 5,624 from 5,514 the month before, but fell short of the 5,675 level expected.  The largest percentage of job opening increases occurred in health care and social services, followed closely by professional and business services.  The chart below shows the total level of private job openings.

Hiring rose, which is good news for the labor market.  The chart below shows total private hires, which improved after two months of declines.

Although hires improved in June, hiring has remained well below job openings, with the ratio of hires to openings steadily trending lower as shown by the chart below.  The difference between the number of openings and hiring may simply be due to the lack of wage growth, although we suspect it is a combination of skills mismatch and lack of mobility that is probably causing most of the problem.

View the complete PDF

Daily Comment (August 10, 2016)

by Bill O’Grady and Kaisa Stucke

[Posted: 9:30 AM EDT] The dollar fell overnight as the market adjusted its expectations lower for a rate hike.  The market-implied probability of a Fed rate hike in September is 22%, and the likelihood reaches 52% in May 2017.  The yields on 10- and 30-year U.K. bonds fell to record lows after the Bank of England indicated it will continue with its uncovered QE operations as planned.

According to reports, Saudi Arabia pumped oil at a record level of 10.67 mmbpd in July.  Production surpassed the previous record monthly production of 10.56 mmbpd in June 2015.  The rise in production was said to stem from increased domestic demand.  At the same time, major OPEC producers met in Doha on Monday to discuss options for stabilizing the market, mostly by imposing caps on output.  Saudi Arabia’s position has been that the country will not agree to production caps unless Iran also imposes caps on its production.  However, Iran has refused to cap production as it recovers its exports after sanctions were lifted.

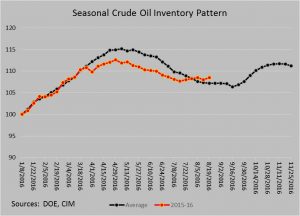
In a separate monthly report, OPEC warned that weakness in the oil markets is likely to persist as supplies remain high and the end of the summer driving season comes to an end, leading to a possible downward correction in prices.  The chart below shows domestic crude inventory patterns.  Although domestic stockpiles did not see the usual accumulation “hump” during the summer, we are now at seasonally average levels.

Refining margins have been squeezed recently due to a high level of product inventories, which means that refiners’ demand for crude could fall.

Palladium prices reached their year high on the back of strong Chinese car sales and supply concerns from Russia and South Africa.  The metal is up 37% since its most recent low in June.  The chart below shows the metal’s price over the past year.  Palladium’s gains are also supporting the rest of the precious metals complex, especially platinum.

(Source: Bloomberg)

View the complete PDF

Daily Comment (August 9, 2016)

by Bill O’Grady and Kaisa Stucke

[Posted: 9:30 AM EDT] It was another quiet overnight session.  Chinese inflation data (see below) was roughly in line with expectations.  U.S. equity futures are modestly higher this morning, and Treasuries are rallying a bit as well.  If anything, market action is consistent with late summer.

However, there are a couple of news items that are interesting.  At the end of July, Ylan Mui of the Washington Post wrote a piece for Wonkblog noting that FOMC members are slowly coming to grips with a world in which growth is persistently slow and inflation remains soft.  Former Fed Chair Bernanke has picked up this theme and noted that FOMC member forecasts have been steadily edging lower.

(Source: Brookings Institute, Bernanke)

This chart shows the FOMC’s long-run projections for growth, unemployment and fed funds since 2012.  Note that growth rate expectations have declined about 0.5%; there has been a similar decline for the “natural” rate of unemployment.  The drop in growth and the lack of inflation has led to a long-run drop in the terminal fed funds rate.  Why has this occurred?  In one sense, it’s because earlier expectations continue to disappoint and so the committee is merely accepting reality.  However, underlying these changes are, according to Bernanke, a change in the economy’s output potential.  As productivity has declined, it takes more workers to generate the same level of growth, which would normally lead to higher wages and, eventually, higher inflation.  But, if growth remains soft, the inflation lift never comes.

In our opinion, the missing part of Bernanke’s analysis is the dearth of discussion over slow wage growth.  We suspect it is coming from three factors.  First, technology is increasingly intruding into new areas of the labor market, reducing the number of people needed to operate the economy.  For those areas not yet affected by technology, the threat tends to keep wages down.  Second, globalization means that firms can search the globe for cheaper alternatives, which depresses wages.  The third component is industry concentration.  As firms merge, there are fewer staff positions available and firms develop market power over labor.

The bottom line is that the FOMC has become increasingly cautious about the economy’s future and thus doesn’t want to make a mistake by raising rates too soon or too much.  Accordingly, the FOMC is likely to be hesitant to raise rates mostly because the economy isn’t behaving as it did prior to the 2008 Financial Crisis.

View the complete PDF

Weekly Geopolitical Report – The Turkish Coup, Part III (August 8, 2016)

by Bill O’Grady

Last week, we recounted the events of Turkey’s recent coup and some of our thoughts about why the coup failed and who was behind it.  This week we will discuss the unfolding purge, including the role of Fethullah Gulen, and discuss the impact on regional geopolitics.  In this week’s report, we will examine the market effects of the coup and its aftermath.

The Purge
At first blush, this coup seemed to be the work of Kemalists in the military.  For example, the coup plotters forced a Turkish state media broadcaster to read a prepared statement which accused the government of “eroding democratic and secular rule of law,” as they declared martial law.  This is fairly standard coup behavior.  However, nearly from the start, President Erdogan accused Gulen of fomenting the coup.  We will examine this issue below.

The scope of those affected by the purge is rather large.

Although a bit more than 15k of military and police have been removed from their posts (and in many cases, under arrest), the education sector has been hit hard, with nearly 28k being removed from their jobs, including 21k teachers who have had their licenses revoked and nearly 1,600 university deans who have been forced to resign.  The purge continues to widen and it appears that the Gulenists are the primary target.  For example, Gulenists are deeply imbedded in education which explains why Erdogan has targeted academia.

In addition to the purge, Erdogan has implemented a state of emergency that will allow him to rule by decree.  We would not be surprised to see this decree extended.  Erdogan is not going to let this crisis pass without extracting the most value he can for it.  We suspect Erdogan intends to reshape Turkey’s government to resolve which Islamic group is going to dominate the country’s future.

View the full report

Daily Comment (August 8, 2016)

by Bill O’Grady and Kaisa Stucke

[Posted: 9:30 AM EDT] Equity markets continue to move higher across the globe as the dollar rises in the wake of Friday’s employment data.  We have seen two consecutive strong employment reports and this has raised expectations of tighter monetary policy.  As tightening expectations ramp up, the dollar is steadily appreciating.  The higher greenback is weighing on gold and the risk-on trend is putting mild pressure on Treasuries, although most of the pressure this morning is coming from a flattening yield curve.

The Chinese trade surplus came in better than expected (see below); however, imports fell significantly, while exports were also weaker than expected.  Falling imports improved the overall trade surplus, but the trend also signals weakening underlying growth.  In general, imports are one of the better signals of economic growth and slowing imports add to evidence that the Chinese economy is sluggish.  This week, CPC leaders are meeting at the seaside resort at Beidaihe, a traditional gathering spot.  The meetings at Beidaihe are informal in nature and no press conferences or communiqués are released, but this meeting will set the groundwork for important leadership changes looming next year.  2017 marks the end of Chairman Xi’s first term.  Five of the seven members of the Standing Committee of the Politburo reach retirement age by next year, meaning major turnover is likely.  It has been reported that relations between Premier Li and Chairman Xi have deteriorated; since Li has the formal mandate for economic policy, we will be watching to see if Xi tries to lift growth in the last year of his term, which would likely offer some support to Li, or if he allows the economy to flounder, blaming Li and using it as an excuse to fire him.  There is rising potential for unrest at the top of China’s power structure, which we will be monitoring as the next 18 months unfold.

We saw something rather odd from Australia in the wake of recent rate cuts.  The major banks cut lending rates in the aftermath of the RBA’s rate decision but raised deposit rates.  This move will, by design, cut margins.  It isn’t that such behavior is unprecedented; unfortunately, it tends to occur when a financial firm is in need of deposits and raises the price it will pay for them by raising the yield.  This situation may simply be a blip, but it bears watching.  In an interconnected world, a banking crisis in a large country could lead to unexpected outcomes.

Here’s a chart from Friday’s employment data that caught our attention.  This chart overlays the unemployment rate for those over 25 years old without a high school diploma or equivalent along with the core CPI.  Since 1997, the particular unemployment rate, with a six-month lag, does a reasonably good job of signaling changes to core CPI.  We suspect this category is the most difficult to employ in the current economy and thus is a measure of the relative tightness of the labor market.  History shows that when this unemployment rate approaches 6%, price levels tend to rise toward 2.5% to 3.0%.  We are already seeing some lift; the employment data suggests that a tighter labor market will probably support tighter monetary policy from the FOMC. 

View the complete PDF

Daily Comment (August 5, 2016)

by Bill O’Grady and Kaisa Stucke

[Posted: 9:30 AM EDT] The big news today is the employment report, which we will cover in detail below.  We do want to note that economic data from Germany and the U.K. were unusually weak and natural gas inventories recorded a rare August draw in stockpiles.

There has been some interesting news emerging from China over the past couple of days.  First, the CPC announced a delay to the National Financial Work Conference, saying it will be held “no earlier than late September.”  This conference, which occurs every five years and has, on occasion, produced important economic changes, is usually held before this date.  Speculation is that the leadership is divided and needs more time to create a consensus.

The other news of note is that the CPC announced a major overhaul to the Communist Youth League (CYL).  The CYL has been one of two paths to power in the CPC, the other being born into fortunate circumstances.  The latter, called “princelings,” are men who are the sons of prominent revolutionary leaders.  General Secretary Xi is a princeling; Premier Li is a CYL man.  It appears that Xi is consolidating power by taking control of the CYL and undermining this path to power, meaning that only princelings will be able to reach the pinnacles of the CPC in future years.  The fact that these two events have occurred so closely together probably means that Xi is concentrating power before he begins his second term next year.  Reducing the influence of the CYL will eliminate a competing power center, and it is likely that Xi is also trying to complete his takeover of economic policy, usually the mandate of the premier.

Finally, the WSJ is breaking news that OPEC may consider an output freeze at an emergency meeting in September.  Russia has noted it has not been contacted about any such meetings.  We suspect this is “oral intervention” by OPEC in response to recent price weakness. We cannot see how Iran would agree to an output freeze as it ramps up output.

View the complete PDF

Asset Allocation Weekly (August 5, 2016)

by Asset Allocation Committee

Last week’s GDP data for Q2 came in below expectations, rising 1.2%.  Consumption was robust, accounting for 2.8% of GDP growth, but investment reduced growth by 1.7% and government peeled 0.2% from output.  Net exports added 0.2% to GDP, but we would not be surprised to see the sector revised downward due to the strength of consumption.  The drop in investment was mostly due to falling inventories, accounting for 1.2% of the 1.7% investment report.  Still, investment remains very disappointing.

This chart shows the three-year average of the contribution to GDP from the four major components of the report.  Government and net exports have been mostly a wash.  Consumption is finally improving, although it still remains well below levels seen in previous expansions.  However, the drop in investment is becoming alarming.  As we have shown in the past, businesses are reducing their savings but are spending the funds on mergers, dividends and share buybacks.  New investment has been rare.

Perhaps the most disturbing part of the report is the growing evidence that the economy “has fallen and can’t get up.”

This chart shows the yearly change in annual real GDP averaged over a decade.  The original data begins in 1901.  About 72% of the time, the trend in GDP growth ranges between 2.0% and 4.5%.  The current period of eight consecutive years of sub-2.0% growth is matched in duration only by the Great Depression.  Although the drop in growth in the 1930s was clearly deeper, the rebound was much stronger as well.  Currently, GDP is weak and showing no signs of improvement.

This chart, though simple, makes a strong case that the economy is in a state of secular stagnation.  Thankfully, the economy isn’t suffering from the terrible policy mistakes of the 1930s.  The Federal government’s fiscal stance isn’t nearly as tight and the FOMC has been much more accommodative than in the Depression years.

First, monetary policy has been more accommodative and reacted quicker to the downturn.

This chart shows three-month T-bill rates during the Depression.  Note that interest rates rose sharply in 1931 and 1933.  Even in 1936-37, the Fed allowed for a modest increase in rates that were part of an “echo” recession from the Great Depression.

Second, the path of fiscal policy was significantly different during the 1930s.

The Obama administration’s fiscal package in 2008-10 was larger than the Hoover-Roosevelt budget deficits.  It is widely held that Roosevelt’s decision to balance the fiscal budget after winning reelection in 1936 triggered the 1937-38 recession.  So far, we haven’t seen such dramatic fiscal retrenchment, and, given the tone of the current election campaign, we would not expect austerity in the future.

However, a key difference to the recovery after the Great Depression was the massive fiscal spending related to the war effort.  It is unknown whether the economy would have been able to return to the 2.0% to 4.0% growth range without the war spending.  It may be the case that a major boost in fiscal spending could be the cure for current slow growth.  However, it should also be acknowledged that (a) it is highly unlikely that a peacetime fiscal spending package could be as large as what was seen in the 1940s, and (b) the war, by design, deglobalized world trade.  A massive fiscal expansion in a globalized world would see much of the potential growth siphoned off to imports.  Only if all the G-20 nations agreed to similar packages could that problem be avoided, and that degree of cooperation is unlikely.

Thus, we expect growth to remain slow and policy accommodation to remain in place.  It makes little sense to normalize monetary or fiscal policy in such a slow growth regime.

View the PDF