Speaking at the Boston FRB conference on October 14th, Fed Chairwoman Janet Yellen indicated that Fed officials are considering the benefits of running a “high pressure economy.” This sparked speculation that the central bank would allow its inflation target to temporarily exceed 2% as the labor market and aggregate demand improve.
The Fed’s dual policy mandate calls for the central bank to maximize employment and maintain stable prices. The central bank has designated a target of 2% as its inflation goal, but has not identified a policy target for employment levels. Optimal employment levels change over time given the cyclicality of labor markets, so it makes sense to keep a moving target for the labor market.[1] But why did the Fed choose to specify an explicit 2% inflation target?
This week, we will take a closer look at the reasons behind the Fed’s 2% inflation target. We will also review the historical data and academic research that support this optimal level of price increases.
[1]The Fed does target a natural rate of unemployment, which is unemployment arising from all other sources except fluctuations in aggregate demand: https://fred.stlouisfed.org/series/NROU.
[Posted: 9:30 AM EST] We are seeing significant market moves this morning, with equities and the dollar sharply higher but Treasuries and gold lower. The proximate cause for the swings came from FBI Director Comey, who indicated in a letter to Congress that the newly discovered emails would not change the bureau’s earlier decision not to pursue prosecution. Although the story of the emails remains to be told (how did they get copied to a “house” computer and what was Anthony Weiner trying to accomplish?), apparently there isn’t anything new here. This doesn’t mean investigations have ended for the Clintons. There is some interest in the activities of the Clinton Foundation that will likely continue. However, there isn’t going to be anything in the emails that will affect this election.
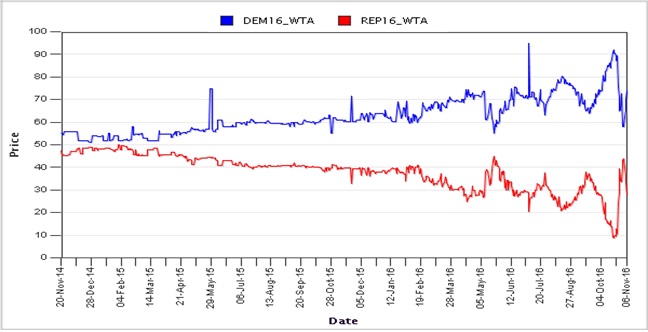
We still think this election is probably closer than the polling data or the betting numbers suggest. We note that early voting among Hispanics was very strong in Florida; at the same time, African American early voting in a number of states, including Michigan, is reportedly soft. The University of Iowa’s Electronic Markets have partially recovered from the earlier Comey announcement.
(Source: Iowa Electronic Markets)
This chart shows the “winner take all” bet. For example, the current bet on Sen. Clinton is just under 70 cents; if she wins, you would receive a dollar. Last week, Clinton’s numbers plunged from 90 cents to around 55 cents, but have since recovered.
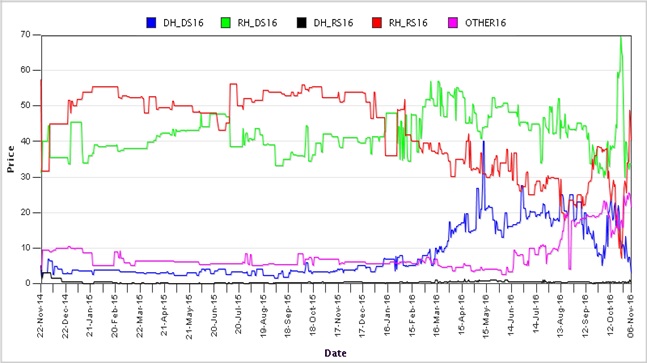
In the Senate, the same source is narrowly predicting a GOP House and Senate.
(Source: Iowa Electronic Markets)
If this is the outcome, it would be a situation of gridlock, pretty much what we have now.
The market reaction to this news is rather striking. Perhaps the most interesting is the dollar’s movement. The dollar fell after the earlier Comey announcement, which struck us as a bit odd. First, Trump wants to aggressively move against foreign trade, which would, if successful, lead to a smaller trade deficit. The trade deficit (or, more accurately, the current account deficit) is the supply curve for dollars. A narrower deficit shifts the supply curve toward the origin and, assuming a normally sloped demand curve, leads to dollar strength. In addition, if Trump were to get a large fiscal spending package through, it would likely push up interest rates (this is what boosted the dollar in the Volcker years). Thus, the dollar’s weakness appears to be due more to uncertainty rather than based on policy.
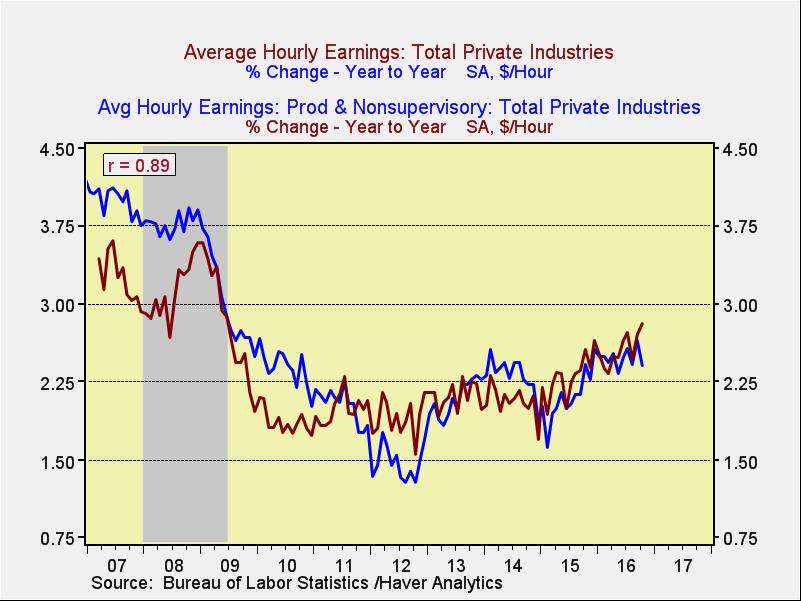
In other news, the FOMC appears to be on track for a December rate hike. Current odds from the fed funds futures show a 76% likelihood. Much was made over the rise in hourly earnings, which is up to 2.8%.
This chart shows the overall hourly earnings data with the hourly earnings growth for non-supervisory workers. Although the two series are tightly correlated, it is worth noting that wage growth for the latter actually fell to 2.4% from 2.7% in September. If wages for non-supervisory workers remain depressed, it would suggest the FOMC should move slowly because wage pressures are not all that strong.
Finally, OPEC is claiming a victory of sorts, with leaders indicating that the cartel has agreed to use outside sources to determine production levels. Most nations prefer to use their own output numbers which they skew to their liking. For example, when quotas are being set, they want to indicate they are producing more so they can claim a higher quota (or cut back less when production is being cut). On the other hand, when output compliance is being questioned, they want to say they have lower output. According to reports, cartel members have agreed, in principle, to use outside sources. In practice, this could be difficult because there is often disagreement among various reporting groups. Without using an average or some adjustment mechanism, it would not be surprising to see states use different sources to their advantage. Thus, the news is progress but it is still unclear if the Saudis will cut without participation from Iraq and Iran.
[Posted: 9:30 AM EDT] Given this morning’s hefty economic releases, we will keep our opening comments short. Equity markets are trading sideways to higher following this morning’s release of the October employment report (see below). Some of the highlights from the report include an improving unemployment rate and better than expected wage growth. Although October payroll gains were weaker than expected, September numbers were revised strongly higher, with the two-month net change surprising to the upside. Additionally, the U-6 unemployment rate, the broadest measure of unemployment, fell to its lowest level since April 2008 as did the median duration of unemployment. The dollar is trading higher this morning as the data likely supports a December Fed hike. Market expectations are calling for an 80% likelihood of a hike at the next meeting.
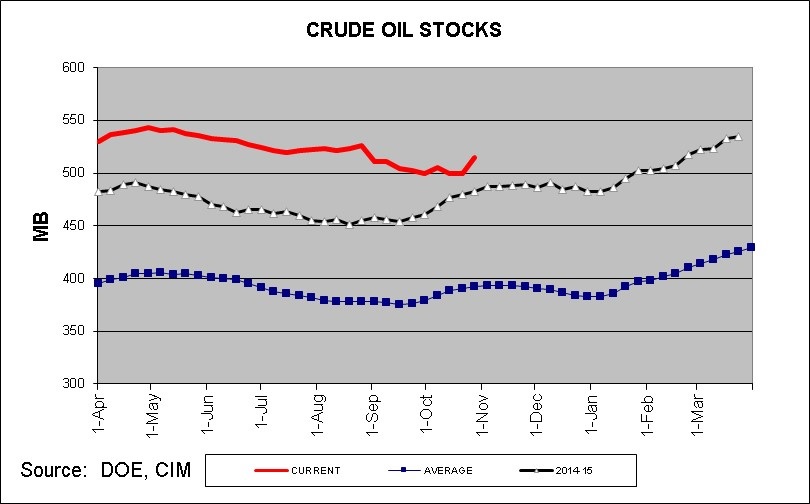
This week’s domestic oil inventories rose 14.4 mb, well above market expectations of a 1.6 mb build. The chart below shows the current level of crude inventories, the prior year’s levels and the five-year average. We are currently higher than the prior year and well above the average.
The inventory increase was caused by a jump in crude imports, which rose 2.2 mb, and a decline in refinery utilization, which fell 0.4% to 85.2%.
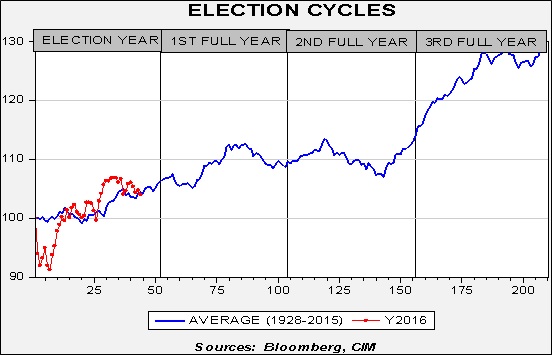
With the elections coming next week, it seems like a good time to look at how markets have historically performed during election cycles. We will compare the current election cycle against previous cycles.
The blue line in the chart above shows the indexed market return for the period 1928-2015. To create this average cycle, we use the weekly returns of the S&P 500 Index starting with the first week of the election year through the end of the fourth year of the presidential term. The weekly dataset begins in 1928. The average gain in the first year of the cycle is about 6%. By Q3 of the second year of the cycle, the average return of the S&P 500 is approximately 13%. Equity markets move sideways to lower into late Q3 of the third year and then, on average, stage a strong rally into the last year before the election cycle begins anew. The rally that begins in year three is a fairly well documented phenomena; politicians want to be re-elected and thus create policies that boost growth and, on average, lift equity prices as well. We have added the S&P 500 performance for the current cycle, indexed to the first Friday close of 2016 (red line). Although the market has been volatile, its performance has been close to average since the dip in Q1.
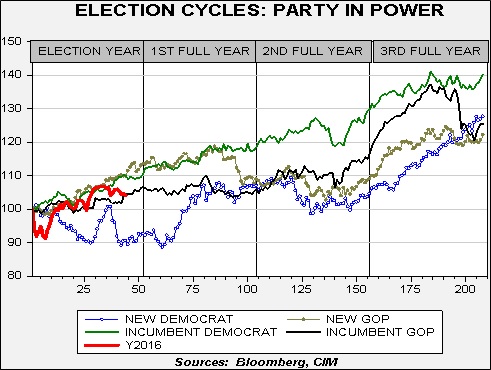
To further analyze the data, we break the historical data into four categories: incumbent Democrat president, incumbent Republican president, new Democrat president and new Republican president. We define incumbent as a consistent party in power. For example, this means we had a Democratic incumbent from 1936 through 1951, which encompassed both Roosevelt and Truman. Similarly, we had an incumbent GOP from 1984 through 1991 which included Reagan’s second term and Bush’s only term.
As the chart shows, markets have had the best outcome when an incumbent Democrat wins. A new Republican president tends to track an incumbent Democrat until the year after the election, then underperforms. A new Democrat has historically been the worst outcome for the market (excluding the late 4th year rally). The current cycle is mostly following the incumbent Democrat/new Republican averages, suggesting that the equity market isn’t offering significant insights thus far. However, it does imply that, regardless of the outcome on Tuesday, we will likely see a recovery into the New Year in that we will either have a new GOP president or an incumbent Democrat president.
Although most analysts are assuming a Clinton win based on polling, this analysis does suggest some equity market trepidation as we are currently underperforming both of the most probable outcomes.[1] This underperformance could reflect the volatile nature of this election season or expectations of monetary policy tightening in December. However, given the usual electoral pattern, we would not be surprised to see a stronger equity market into at least the first half of next year.
[Posted: 9:30 AM EDT] First, we would like to congratulate the Chicago Cubs on ending their 108-year championship drought.
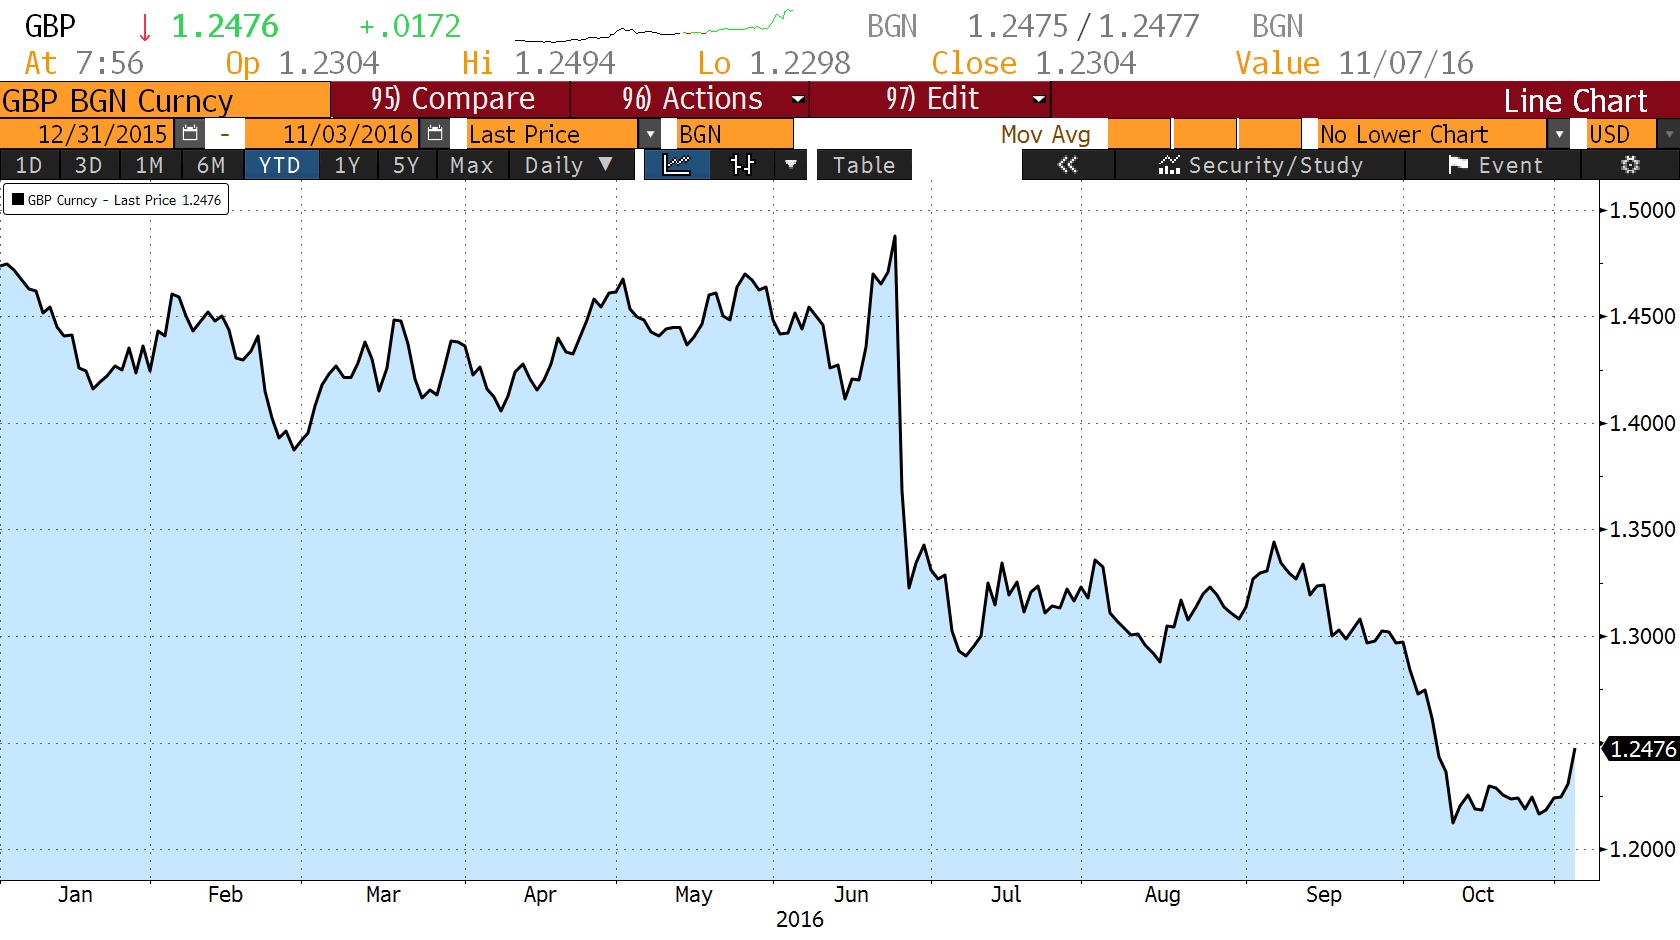
A panel of London judges decided overnight that the U.K. must hold a Parliamentary vote before triggering Article 50 of the Lisbon Treaty to start the two-year process to withdraw from the EU. The ruling hinged on the fact that Brexit would lead to a change in domestic law without Parliament’s approval. The final court ruling will come from the country’s Supreme Court next month. This complicates PM May’s intent to unilaterally start Brexit by March of next year. As shown in the chart below, the pound rose on the news as investors await PM May’s response on whether she will have to alter her Brexit plan. It is likely that the debate will move to the Parliament for a vote, but May had indicated earlier that enough MPs support triggering Article 50 that she believes the vote would pass in favor of the measure.
(Source: Bloomberg)
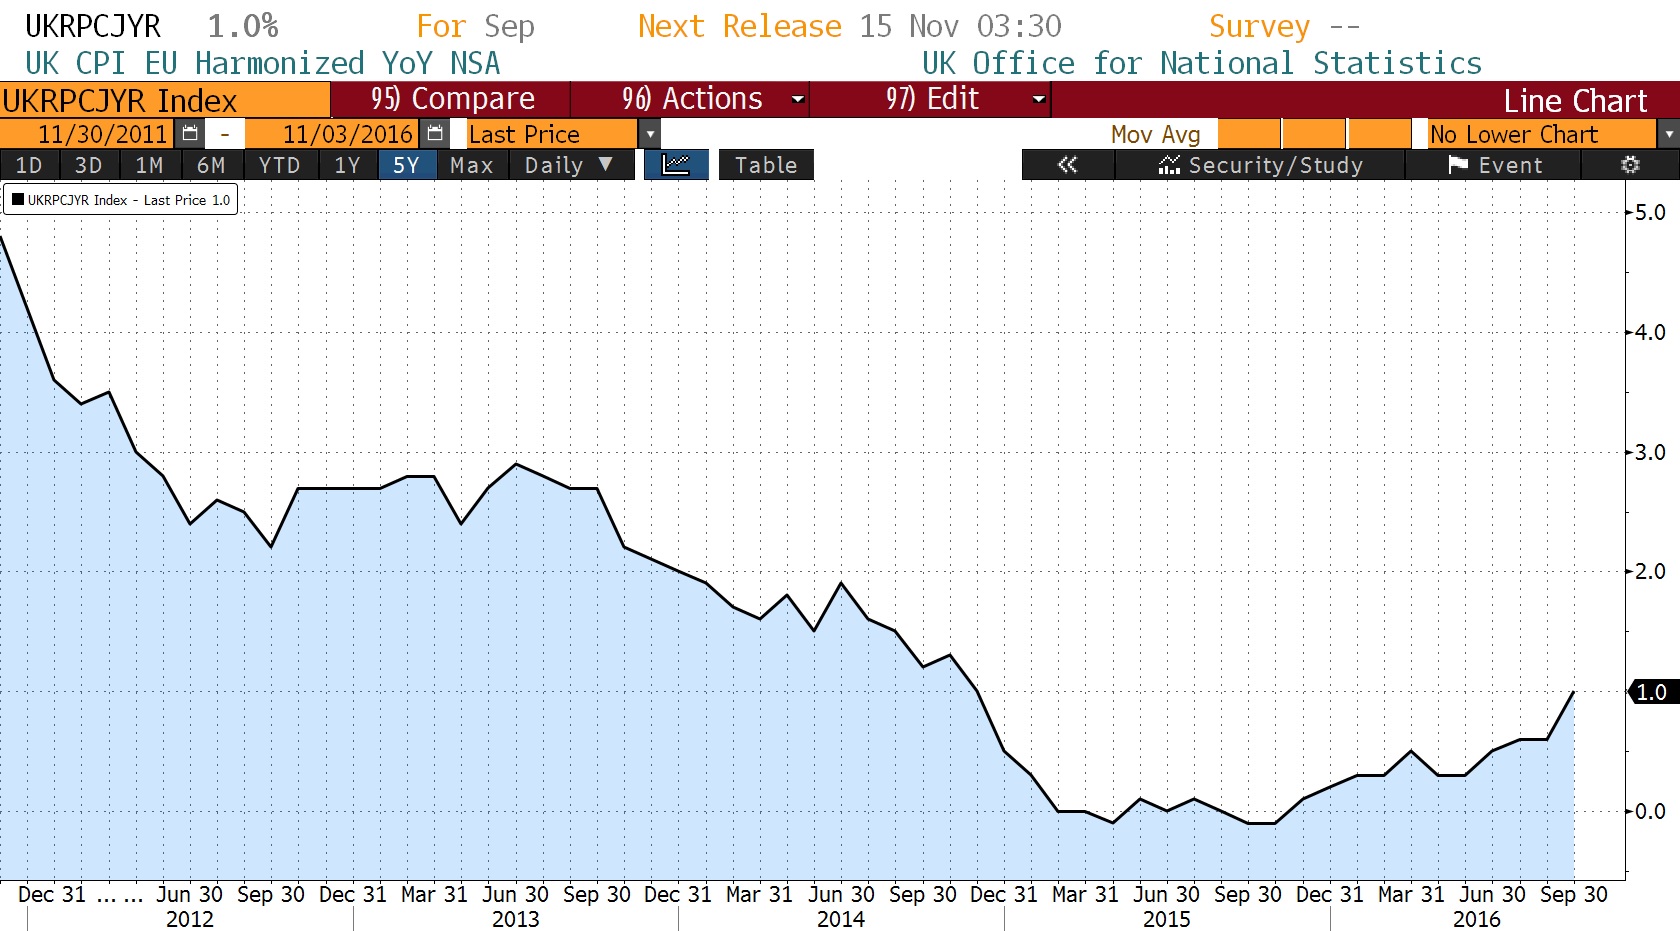
Separately, the Bank of England also released its rate decision. The bank maintained rates at 0.25%, as expected, after lowering them in August on speculation that the Brexit vote would adversely affect the country’s growth. The Monetary Policy Committee (MPC) projections now forecast higher inflation, with the CPI rising to 2.0% early next year and 2.5% by 2019. The chart below shows the annual change in the U.K.’s headline CPI, which rose to 1.0% in September from 0.6% the year before.
(Source: Bloomberg)
Interestingly, the MPC removed language from its communication signaling another possible rate hike this year. In fact, the bank said that there are “limits to the extent to which above-target inflation can be tolerated,” implying that it could move its benchmark interest rate in either direction based on economic conditions. The committee also revised its short-term growth rate higher, while revising the long-term growth rate lower. The bank is concerned about the inflationary pressures on household spending and political uncertainty surrounding Brexit. Volatility is likely to remain elevated leading up to the Supreme Court ruling, ensuing Parliamentary vote and Brexit negotiations.
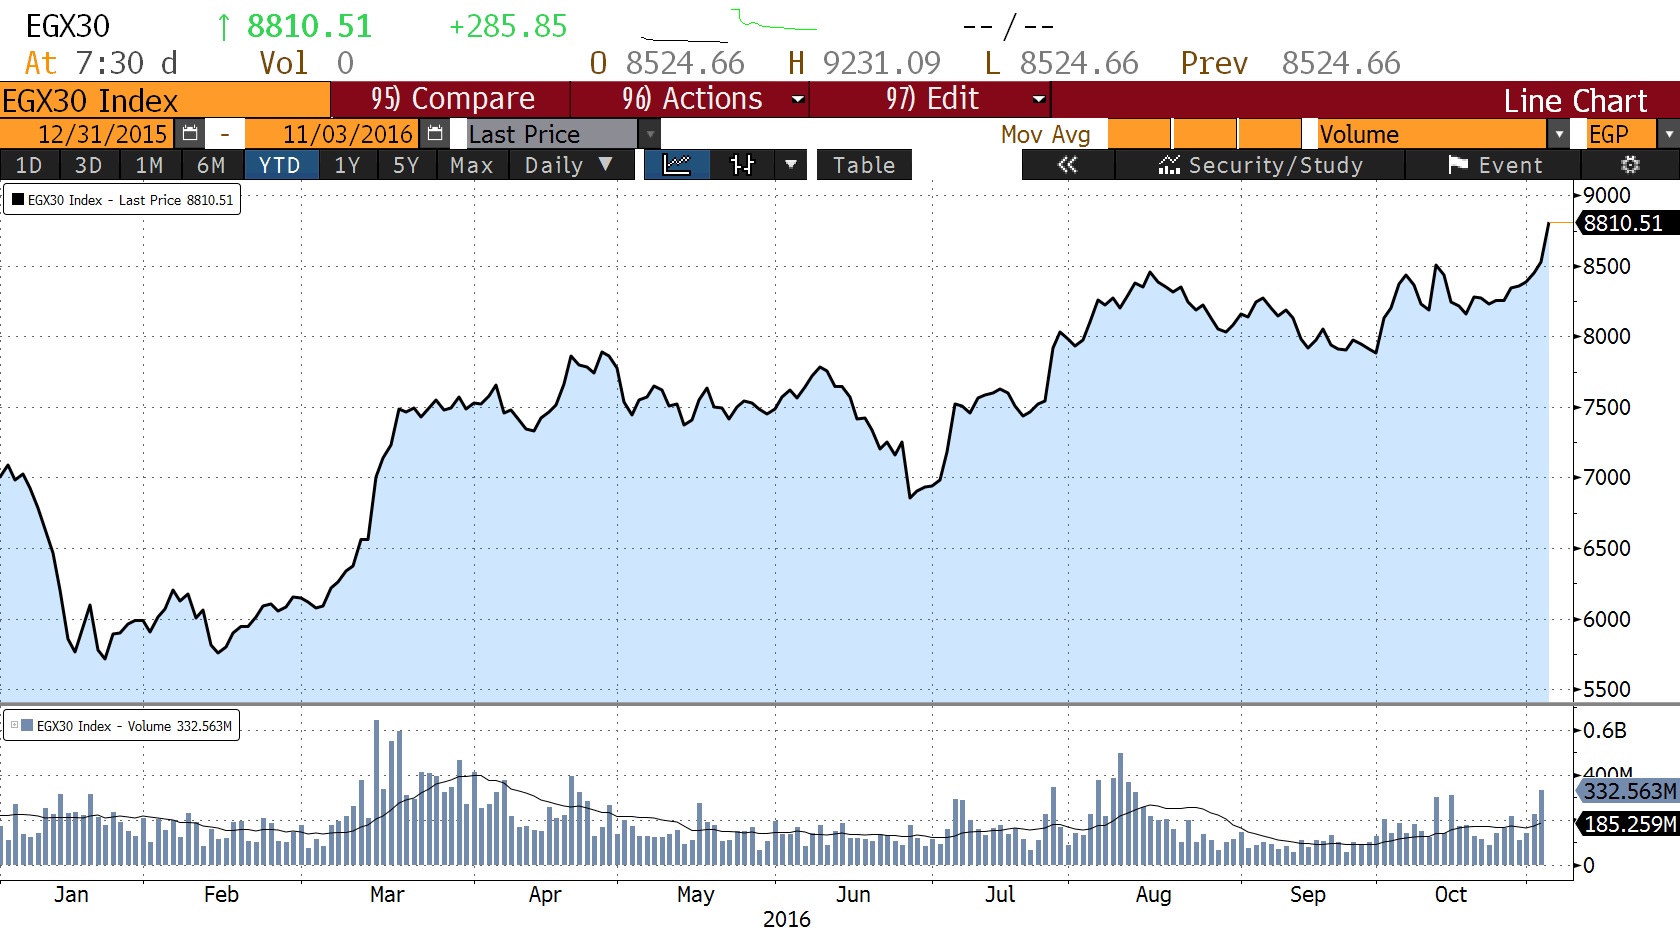
The Egyptian central bank said that it would allow the country’s currency, the pound, to float in response to a persistent dollar shortage, which has depressed economic growth. The country will end exchange rate controls and hike interest rates. The country has a dual objective in ending exchange controls. First, it is hoping to attract foreign capital flows back into the country. Political uncertainty following a series of uprisings had alarmed investors, who pulled funds out of the region. We note that capital controls for foreign investors remain in place. Second, the policy change could help the country secure an IMF loan.
The Egyptian equity market rose, shown in the chart below. Additionally, Egypt’s bond yields fell.
[Posted: 9:30 AM EDT] Risk markets continue to trade lower this morning as anxiety over the election has increased. This morning, a Bloomberg Politics independent poll reported a tight race, with Clinton receiving 39% of the undecided vote over 35% for Trump. When third-party candidates are added, Clinton holds a 3% lead over Trump, receiving 30% of the votes. The Washington Post-ABC News Tracking Poll reported this morning that Clinton supporters’ enthusiasm has waned somewhat after the news of the FBI re-opening her e-mail case.[1] Both candidates run nearly even, with 46% of the vote for Trump over 45% for Clinton.
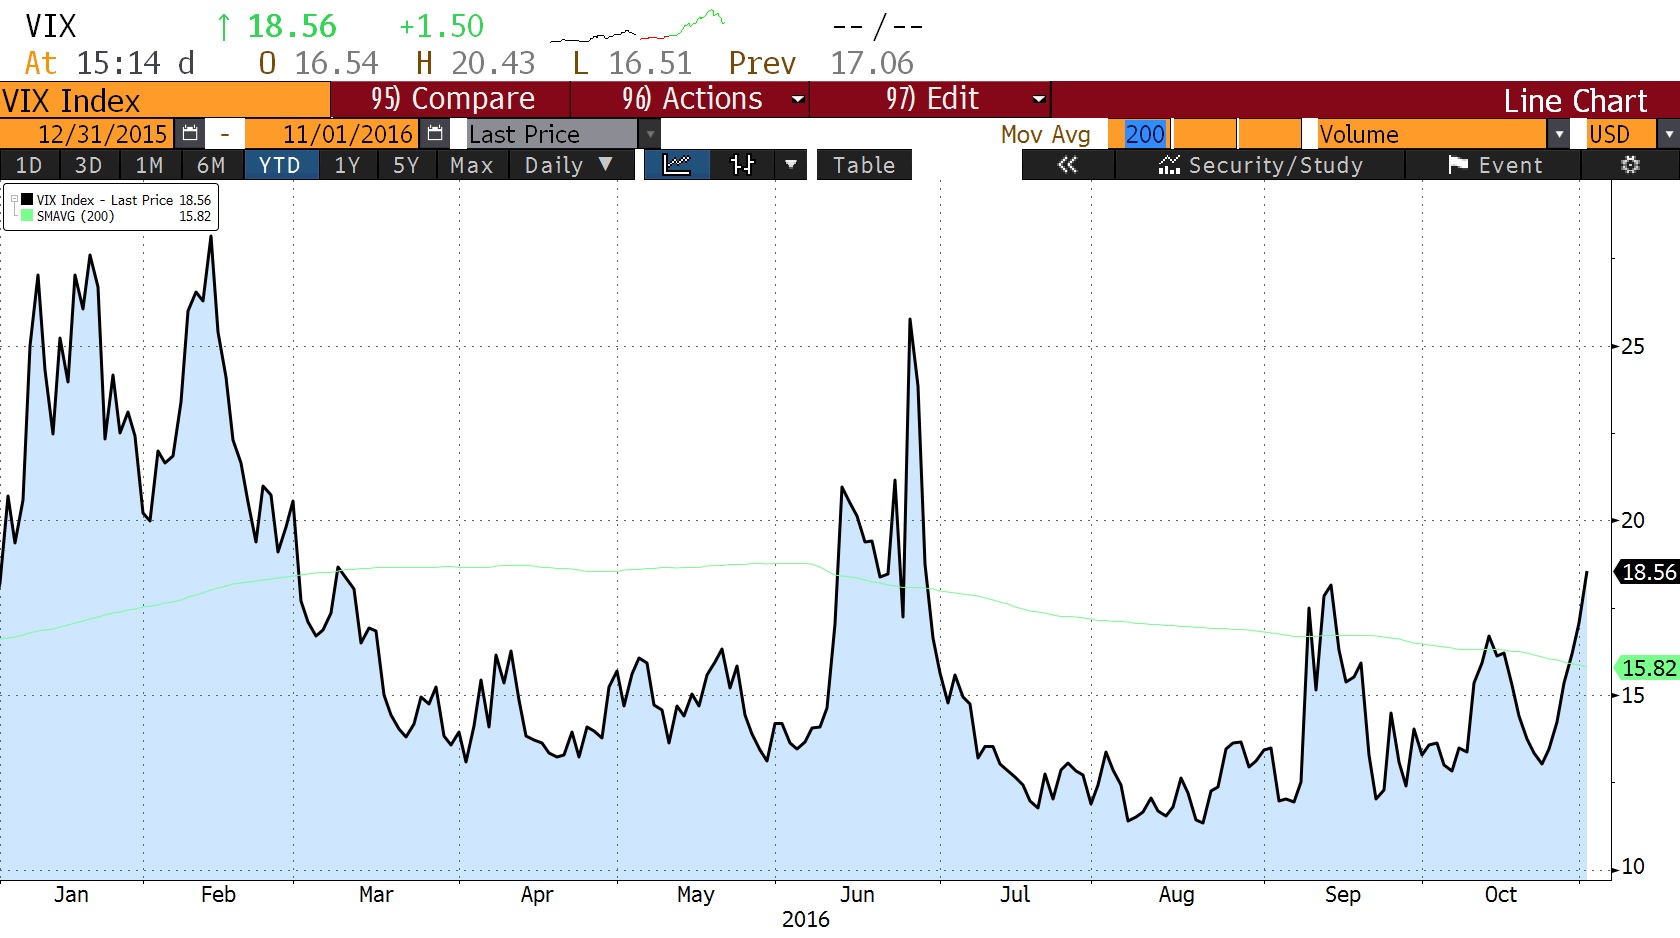
Market volatility has increased leading up to the final week before the elections. The CBOE VIX index, which measures market expectations of near-term volatility, has risen for the past six trading days and is trending higher again this morning. The chart below shows the YTD level of the index. Although volatility has risen, it remains well below the risk market sell-off levels from February and the mid-summer uncertainty.
(Source: Bloomberg)
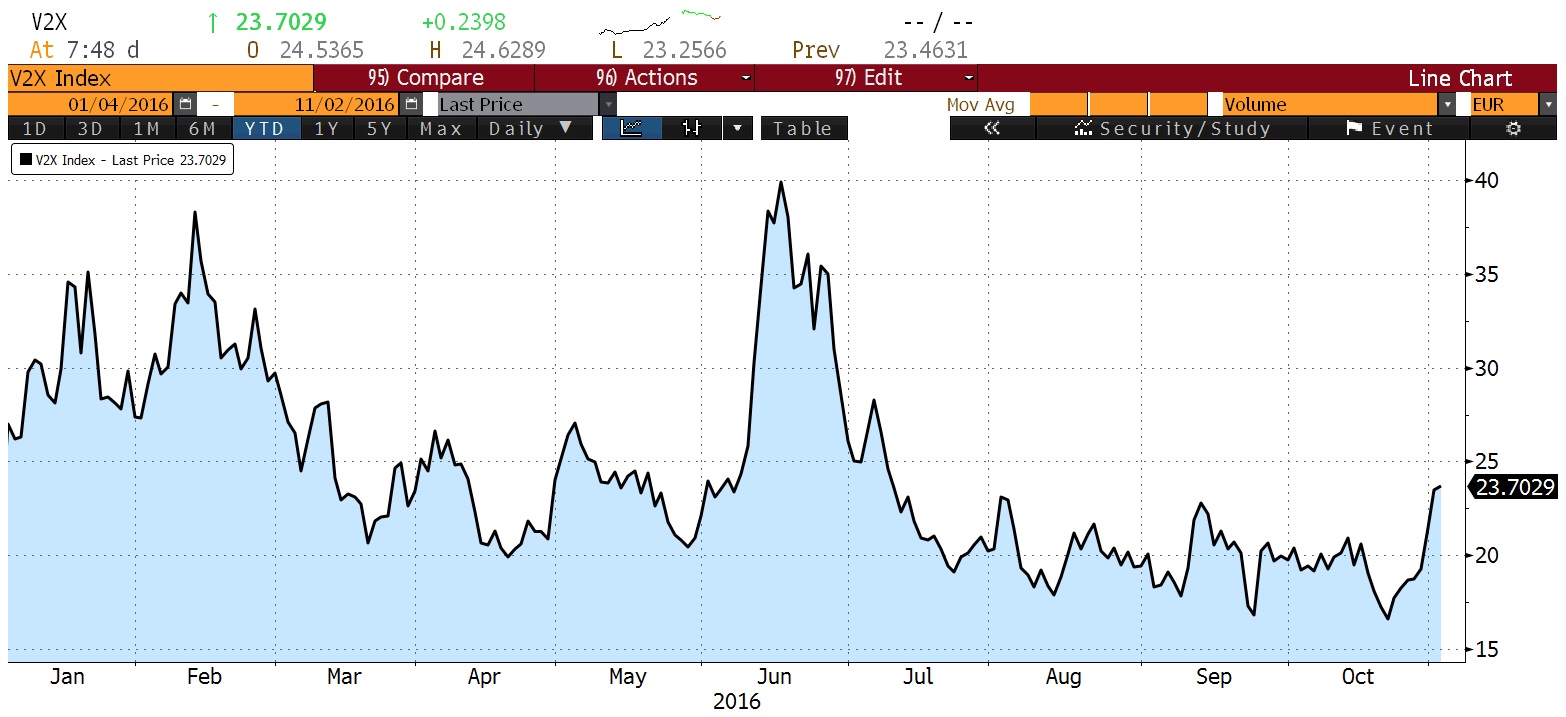
Volatility has also increased in Europe but remains well below the volatility levels of the Brexit vote. The chart below shows the VIX index for Europe.
(Source: Bloomberg)
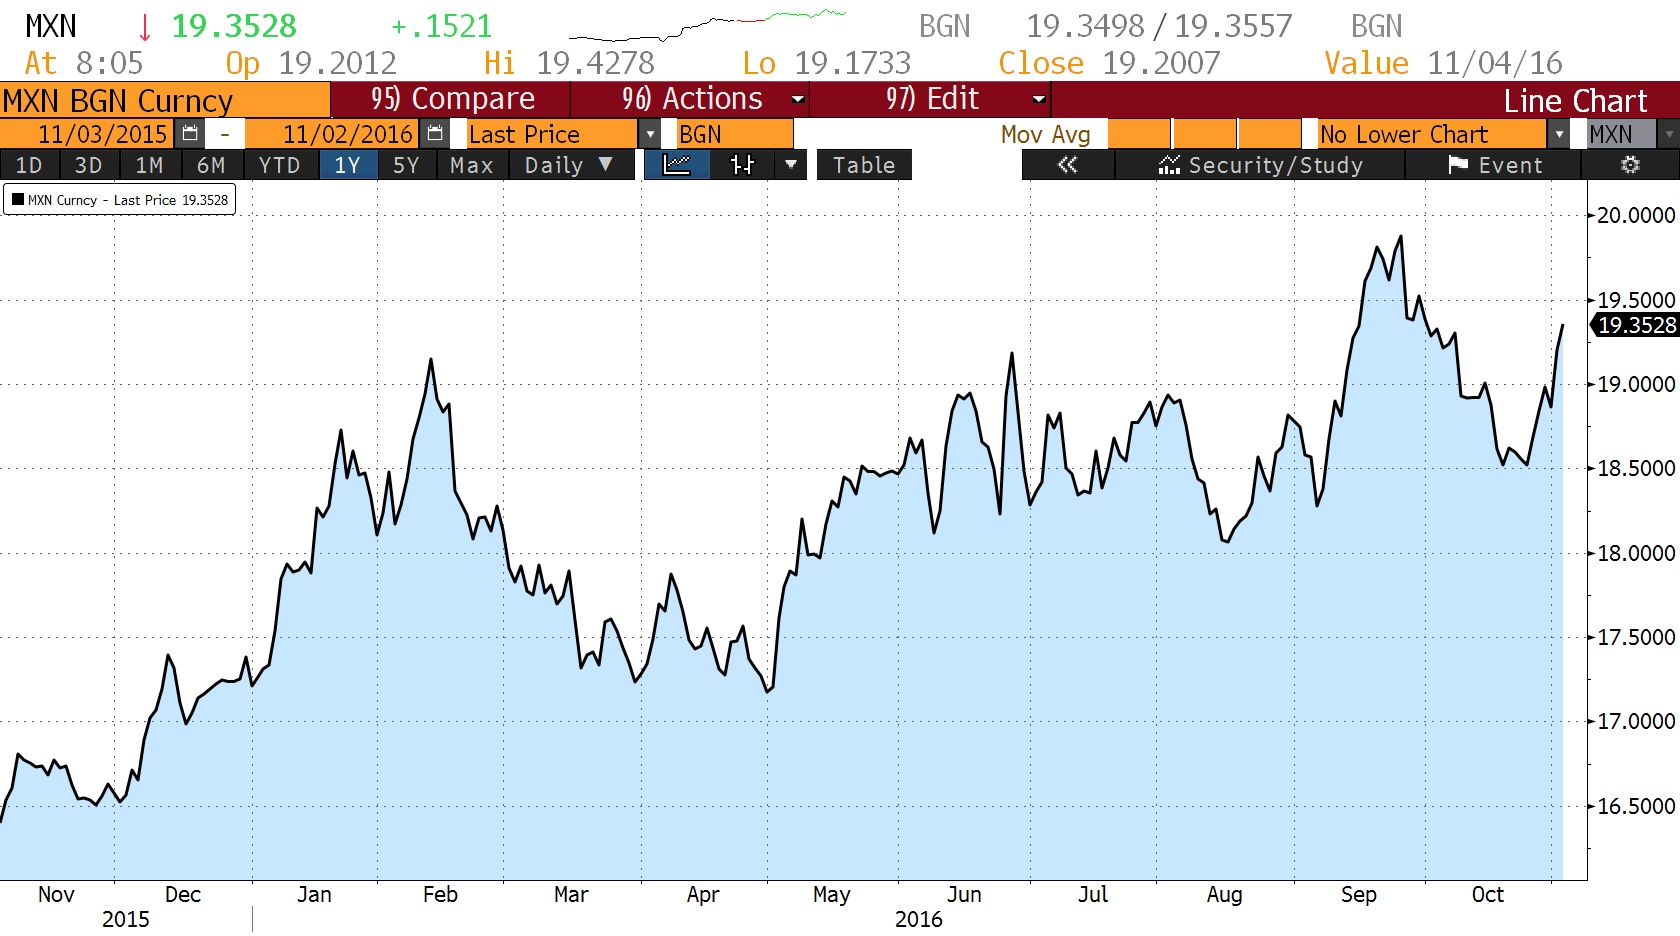
The Mexican peso, which tends to fall when the market perceives Trump gaining over Clinton, has trended lower over the past week. The chart below shows the peso per dollar ratio—a higher reading means a weaker peso. The currency has weakened recently but remains stronger than the September levels.
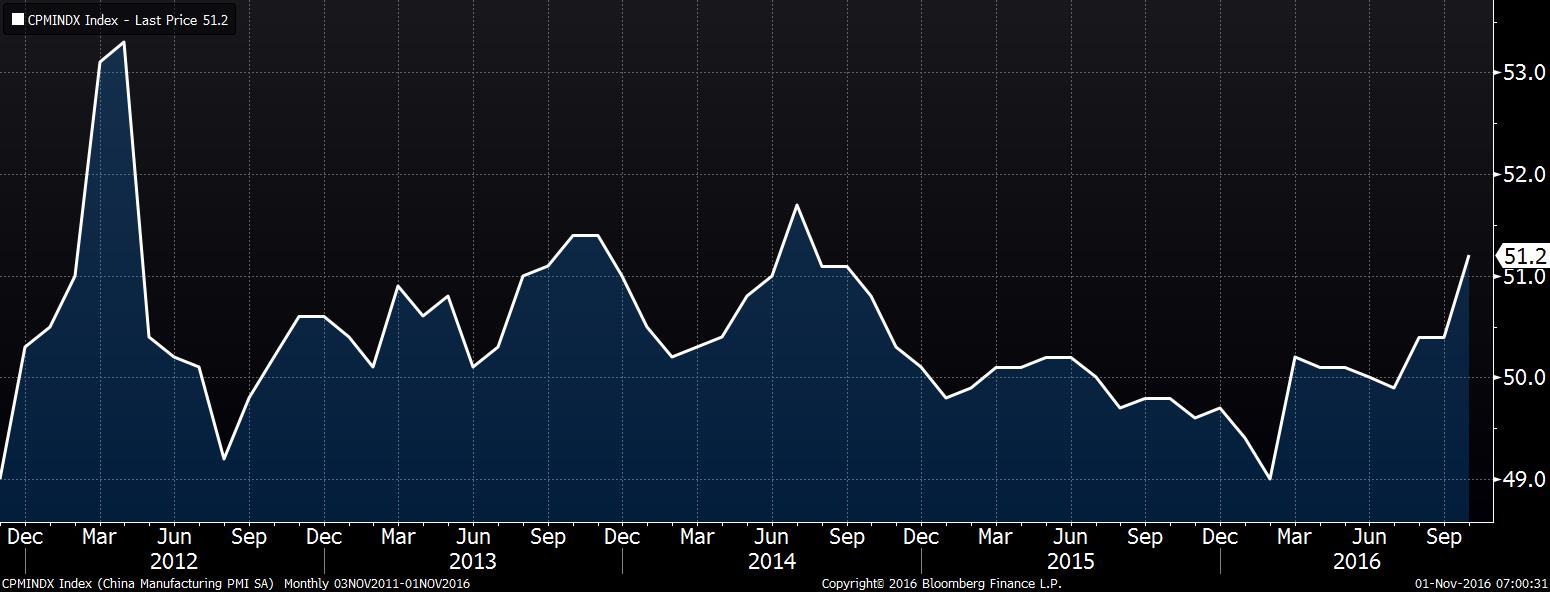
[Posted: 9:30 AM EDT] The big news overnight came from China, where the PMI data was better than forecast (see below). The chart below of the Caixin[1] PMI shows evidence of an improving Chinese economy.
(Source: Bloomberg)
The PMI has been improving since Q1, with a clear rise since late summer. Chinese officials have been allowing debt to rise which has boosted growth. This increase in debt does come at a cost. Today’s WSJ notes that a series of asset price jumps have occurred in a number of markets, likely due to excessive money supply growth.[2] It should be noted that other Asian markets’ PMI data was solid as well. Australia rose above the expansion line to 50.9 in October, up from 49.8 in September. The U.S. ISM data will be out later this morning.
On monetary policy, both the Reserve Bank of Australia and the BOJ made no policy moves, although the former’s statement was dovish. Still, the AUD is up this morning on the improving PMI data.
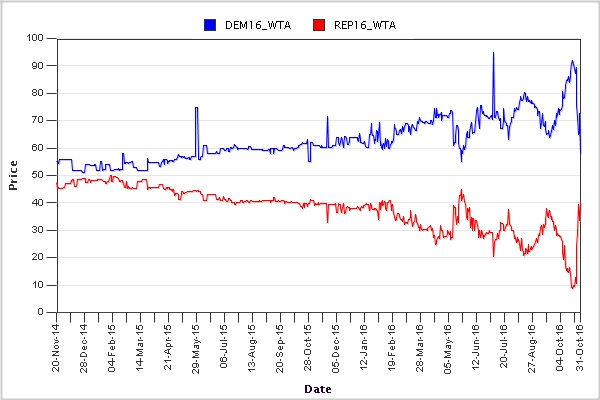
On the election front, there is some evidence to suggest the new email revelations are having an effect. Although polling has been mixed, the Iowa Electronic Betting markets have moved violently in favor of Mr. Trump.
(Source: Iowa Electronic Betting Markets)
The bets reached 90% for Clinton last week but the new information seems to have led to the obvious swing. We note that the bulk of the volume was buying Trump as opposed to shorting Clinton. Although this “winner take all” still favors Clinton, the volatility does suggest that support may not be all that solid. In other words, the race appears to be tightening with the vote merely a week away.
China appears to be close to another diplomatic breakthrough. The DOJ has been investigating Malaysia’s sovereign wealth fund; there are reports that $1.0 bn may have been embezzled by people close to the prime minister. These funds were used to buy assets, including U.S. real estate. PM Najib, angered by this embarrassment, is courting China by signaling it will buy military equipment from the country. China has made significant inroads in the Philippines and if Chairman Xi can make similar gains in Malaysia then America’s “pivot to Asia” will be in shambles.
In China, there are increasing reports that Chairman Xi is pressing to break the informal rule that members of the Standing Committee of the Politburo, the most powerful body in China, must retire by age 68. According to the Chinese media, Xi wants to elevate Wang Qishan to premier, the second most powerful position. Wang currently runs the anti-corruption campaign that has swept hundreds of officials from government. Not only would this move violate the unwritten rule, but it would also demote Li Keqiang, the current premier. Elevating Wang would boost Xi’s position and perhaps allow him to stay beyond the two five-year terms in office.
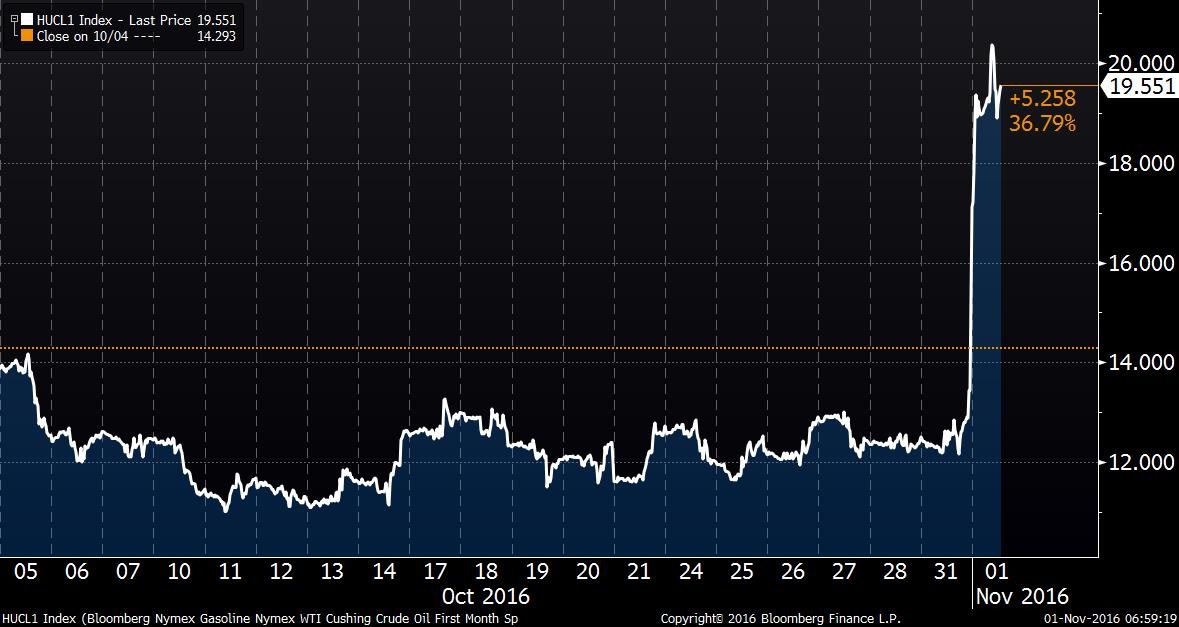
Finally, the Colonial pipeline suffered a fire near Shelby, AL overnight, cutting off much of the southeast and Atlantic states from a key source of petroleum products. Gasoline futures jumped over 10% overnight as the NY harbor is the delivery point for the CME gasoline contract. Gasoline prices soared relative to crude oil as well.
(Source: Bloomberg)
We would expect this break to be fixed within a week or two but the Eastern Seaboard will see a temporary jump in gasoline prices.
[1] This PMI is independent of the official PMI data. The Caixin data covers more smaller enterprises and is considered a broader measure of manufacturing activity compared to the official data.
In Part 1 of this report, we discussed how the reserve currency facilitates trade, provided a short history of the dollar’s evolution as the reserve currency and examined the theoretical backdrop of the reserve currency and its role as a global public good.
In this week’s report, we will conclude with the economics and geopolitics of the reserve currency and discuss potential market ramifications.
The Economics of the Reserve Currency
When the U.S. accepted the reserve currency role in 1944, the U.S. economy dwarfed the rest of the world. However, the relative size of the American economy has declined, in part due to the success of U.S. policy in rebuilding the free world after WWII. This situation accelerated with the development of China. On a purchasing power parity basis, the U.S. is currently the second largest economy in the world, with China being the largest.
There was lots of news over the weekend. Let’s dig in:
The return of the emails. On Friday, FBI Director Comey announced the agency had come across a massive number of emails related to the private server issue that somehow ended up on a computer in the household of Anthony Weiner and Huma Abedin. The latter is a long-time close aide to Sen. Clinton. It is unclear what, if anything, is in these emails. In fact, it’s not obvious how these emails ended up on a laptop reportedly controlled by Weiner. The emails were discovered because the FBI was investigating a different issue with Weiner. Whatever the reason, this issue has resurrected itself just about a week before the election. Here is our take:
There is no way the FBI can get through all these emails before the vote. According to reports, some 650k emails were gathered and, with a mere eight days before the vote, it is physically impossible to vet them all. Thus, the odds of a blockbuster revelation before the election are low.
It probably doesn’t swing the presidential election, but it might affect the down ballot vote. It’s hard to imagine there are any more truly undecided voters between Trump and Clinton. Both offer stark differences in policy direction and thus, by now, most voters have probably made up their minds, regardless of what they tell pollsters. However, the news might encourage voters to opt for the familiar in terms of Senate and Congress, which would favor the GOP.
Comey was stuck. Earlier this year, when FBI Director Comey opted not to recommend an indictment against Sen. Clinton, Democrats lauded his position and Republicans wanted him to resign. On Friday and through the weekend, the same support and criticism was expressed, but the party names had been switched. Comey’s problem was that in the face of this huge amount of potentially new information, if he had kept quiet and something was revealed to trigger an indictment, he would have been accused of throwing the election to the Democrats. Some Democrats claim that all of the new information is actually old information, which cannot be ascertained in advance; at the same time, it is probable that much of what has emerged isn’t new.
It didn’t help Comey that AG Lynch has been compromised by her ill-advised contact with the Clintons. She really could not offer any guidance. If she suggested the FBI should wait, it would be unclear whether she was taking that position because she didn’t believe the new emails were material or if she was offering allegiance to the Clintons. About all that Lynch could do to remain above reproach would be exactly what Comey did, and she would have made herself the target of what Comey is now suffering.
The email uncertainty will plague a President Clinton should she win the election. As we have discussed before, new presidents have a limited amount of political capital that has a “sell date” of about 18 months after the inauguration. A President-Elect Clinton would already have less than a normal new president because she ran a campaign similar to that of a sitting vice president, who wins by vowing to maintain the policies of the predecessor. The email issue would further require a President Clinton to spend precious political capital to defend herself from charges that could stem from this investigation.
A President Clinton, wounded by the ongoing investigation, may be forced to tack to the Sanders-Warren wing of the party. The Sanders-Warren wing could offer Clinton unwavering support in return for getting their preferred candidates in key cabinet positions. Depending on how dire the investigation becomes, she may seek shelter in this wing of the party. If so, regulations could take a much harder turn to the left on both the financial system and the environment.
So, our take is that the emails will take the focus off of the Trump campaign and will cause the polls to tighten (which it appears has already occurred). However, we have been holding a rather jaundiced eye toward the polls anyway on fears that preference falsification is rampant in this election. Our probabilities haven’t changed—we see a 10% chance of a Clinton landslide, a 50% chance of a narrow Clinton win and a 40% chance of a narrow Trump win.
Will Carney leave? The weekend British press reported that BOE Governor Carney is preparing to resign. The FT’s lead story this morning scotched these reports, which appear to have emerged from the right-wing press in Britain. Carney supported the Remain campaign and Brexit supporters have been furious with him. At the same time, Carney has been a steady hand during this period of tumult and it would be quite bearish for the GBP if he were to exit early. If he stays his entire term, he will be in office into 2018.
OPEC fail? OPEC held informal meetings over the weekend to hash out production adjustments before the major meeting on Nov. 30. The meetings did not go well. Iran and Iraq insisted that they should not be forced to cut output. Iran says it is still recovering from sanctions and Iraq says it’s fighting a war against IS and needs the revenue. It seems that if cuts are going to come, the Saudis will be the primary source, forcing the kingdom back to the “swing producer” role it has rejected since the mid-1980s. Since Saudi Arabia has priced its bond issue, we would be surprised to see the kingdom shoulder most of the burden of output cuts. Non-OPEC producers rejected the idea of cuts if OPEC isn’t able to negotiate a deal. Although hope still exists that the cartel can engineer a cut by the end of November, it looks increasingly unlikely. If no deal emerges, a retreat to the $40 to $45 range for oil prices is likely.
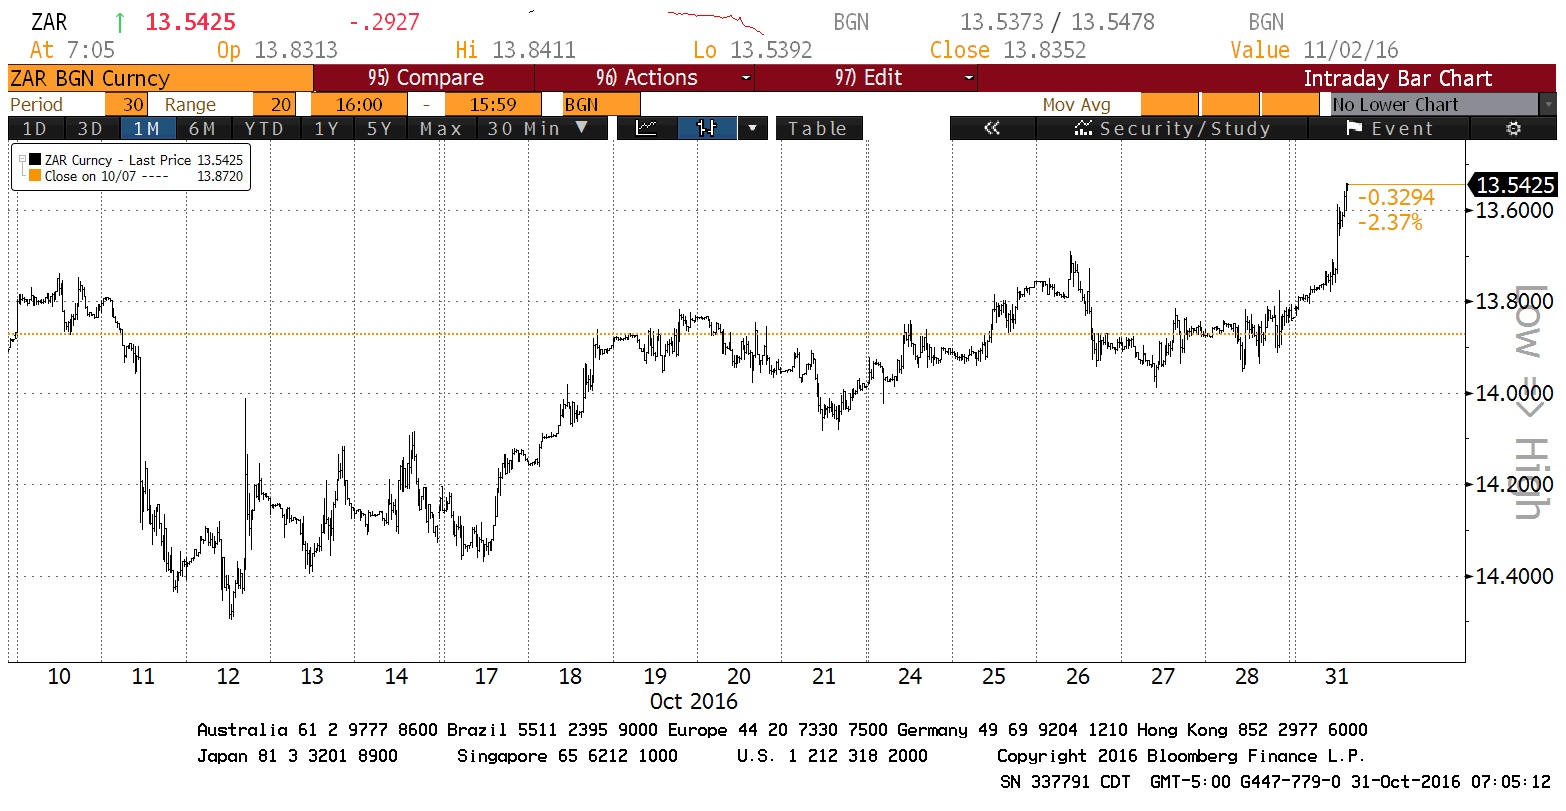
Charges dropped against Gordhan. Earlier this month, South Africa’s finance minister, Pravin Gordhan, was due to face charges on corruption, which appeared to be politically motivated. This morning, we learned these charges will be dropped. The South African rand rallied.
(Source: Bloomberg)
This chart shows XAR per USD on an inverted scale. Note how the currency rallied today.
We use cookies to ensure that we give you the best experience on our website. If you continue to use this site we will assume that you are happy with it.