Asset Allocation Weekly (March 23, 2018)

by Asset Allocation Committee

Last week, the Federal Reserve published its Financial Accounts of the United States report, formerly known as the Flow of Funds report.  The report is a storehouse of important financial information.  In this most recent report, a few things emerged that raised concerns.  The first issue is net saving.  Net saving is a macroeconomic identity; for every sector that saves, some other sector must dissave so the four major sectors of the economy—business, households, government and foreign—balance to zero each quarter.

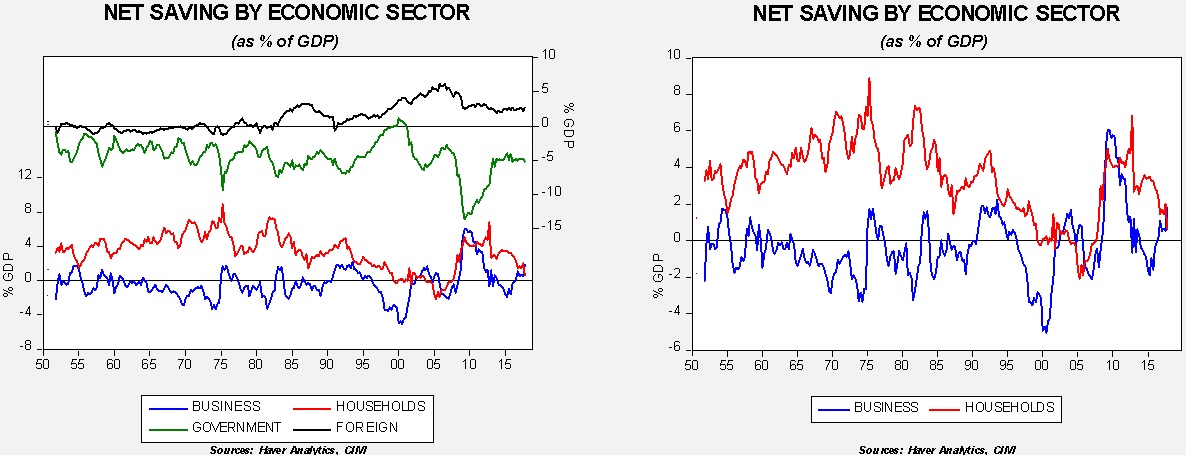
The chart on the left shows the four major sectors.  Household saving is income less consumption, business saving is revenue less investment, government saving is taxes less spending and the foreign sector is the inverse of the current account.  All the data are scaled by GDP.  Business saving vacillates between saving and dissaving; when businesses dissave, it means their investment exceeds their income and they are using the capital markets for funding.  This chart shows important long-term trends in the economy; household saving peaked in the mid-1970s and fell steadily into the Great Financial Crisis, with dissaving in 2004-05.  Foreign saving (a larger trade deficit) became common during the 1980s and has remained elevated ever since.  To accommodate the foreign saving, either government or the private sector has lowered saving rates.

The chart on the right shows a rather disturbing development—a sharp drop in household saving and a commensurate rise in business saving.  It isn’t clear what exactly caused households to lower their saving, but it could be that households were anticipating the tax cut and increased their spending.  It’s also not clear why businesses boosted saving.  In general, rising business saving comes at the expense of lower investment.  One quarter’s data doesn’t make a trend, but if this pattern persists it would suggest lower future household consumption (eventually, the lack of saving undermines spending) and a decline in investment.  Given that government dissaving is poised to rise and the president wants to impede trade, the domestic private sector would be called upon to fund the public deficit.  That development would likely lead to slower growth.

The second issue shown in the recent report is that household deleveraging appears to have ended in Q4.

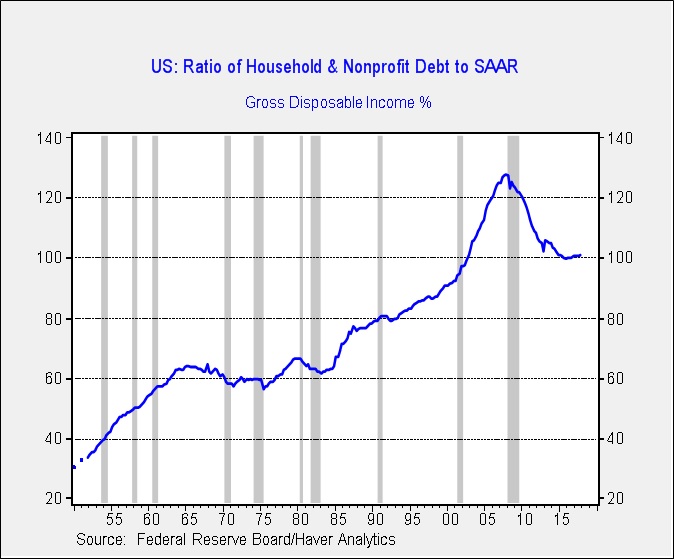
This chart shows household debt as a percentage of after-tax income.  Although this ratio stabilized in 2016, it rose this quarter to its highest level since Q4 2014.  Although not a major increase, the trend is disturbing because we doubt households have much additional debt capacity.

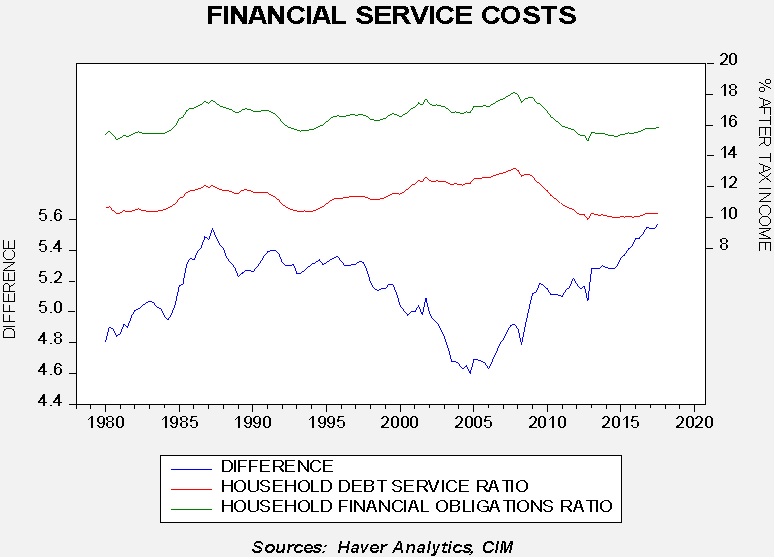
The two upper lines in this chart show the household financial obligations ratio, which includes debt payments plus auto leasing payments, rent, property taxes and homeowners insurance relative to after-tax income, and the household debt service ratio, which is just debt service (mortgage and consumer credit) relative to after-tax income.  The lower line on the chart shows the difference between the two ratios.  Both ratios have been rising but the financial obligations ratio has been increasing faster, likely reflecting higher rent payments.  The difference, which has distributional effects, is now at record levels.  The other concern is that both ratios are rising at the same time as tightening monetary policy.  Rising interest rates coupled with higher levels of debt will likely mean rising debt obligations, which will eventually weaken consumption.

While our analysis of the economic data still suggests a recession won’t happen this year, the trends in some series do suggest the cycle is aging and the potential is rising for a slowdown in 2019.  We continue to monitor the data closely as this year unfolds.

View the PDF

Daily Comment (March 23, 2018)

by Bill O’Grady and Thomas Wash

[Posted: 9:30 AM EDT] It was a dark and stormy night for risk assets.  However, we are seeing glimmers of light in U.S. equity futures as they have recovered their overnight losses and have turned positive.  Here’s what we are watching:

A budget deal: The budget deal passed Congress, meaning a shutdown was averted.  Along with it is a clear ending of austerity.

This chart shows the contribution of government spending to GDP, smoothed with a three-year moving average.  This chart always comes as a surprise; this only measures what the government spends on goods and services.  Much of government spending is transfer payments which are captured by the consumption or investment sectors of the economy.  As the chart shows, we have only seen two other periods when government spending detracted from growth and both occurred during periods of military demobilization.  It is remarkable to see government spending reduce growth during a period of overall weak economic activity.  Much of this weakness was due to falling state and local government revenues; these entities usually cannot deficit spend so, as revenue declined, so did their spending.  However, the federal government did not offset these declines due to the austerity policy of sequester.  That policy is clearly over.  Thus, government spending will now provide support for growth.  Of course, deficits will rise as well.  This will either lead to (a) a wider trade deficit, or (b) higher inflation.  [BREAKING: President Trump tweets he may veto the spending bill due to the lack of wall funding and the lack of resolution on DACA.  However, if there is a veto, the shutdown will likely be short and, if anything, more spending will be the result.]

John Bolton: H.R. McMaster was ousted from his position as National Security Advisor, effective April 9, and will be replaced by John Bolton.  Bolton has extensive government experience and is a well-known policy hawk.  This is the president’s third National Security Advisor.  Michael Flynn left early in the term due to scandal, while the president and McMaster never got along and reports suggest that Tillerson and Mattis were not fond of McMaster.  However, Bolton is an entirely different figure.  He is an experienced Washington hand who is well versed on how to use the apparatus of state to move policy.  He is on record calling for military action against both Iran and North Korea, and he supported the invasion of Iraq.  Although much of the media is framing this decision as the president selecting a National Security Advisor who is more aligned with his views, it should be noted that the president’s positions are fluid while Bolton’s are quite consistent.  Thus, if talks with North Korea bring a thaw, it’s hard to imagine Bolton will like this outcome and he may be vocal in his opposition.  Bolton and Trump do appear to be on the same page regarding Iran, which means the nuclear deal is clearly in danger and the Middle East could be heating up.  In response, we have seen oil and gold prices lift.

Trade:  China announced token retaliation against the administration’s announced sanctions.  Although trade policy is worrisome, we want to reiterate that, at least so far, the bark has been far worse than the bite.  We view what has transpired so far as warning shots across the bow rather than the onset of hostilities.  If everything the U.S. has announced is implemented, it will affect about 10% of China’s exports to the U.S. and 2% of its global exports.  That’s not to say what is happening isn’t important.  To some extent, targeting China probably signals the fact that the U.S. is no longer treating China as an emerging capitalist democracy but as a strategic competitor.  For the past three decades, the U.S. has allowed China to engage in openly mercantilist trade policies on the assumption that rising income would eventually force the CPC to democratize.  That assumption has mostly been proven false and now the U.S. has to fashion a new response to China.  This trade action by the administration will probably be seen by historians as the beginning of this process.

The recent action in steel equities offers a cautionary tale of how difficult it is to position investments in this trade policy environment.

(Source: Bloomberg)

This is a chart of the S&P steel sub-index.  Expectations of trade action lifted this group in February.  Since March 9, the index is down 12.1% as the administration exempted allies from the steel tariffs.  Clearly, it is hard to position for such policy uncertainty.

View the complete PDF

Daily Comment (March 22, 2018)

by Bill O’Grady and Thomas Wash

[Posted: 9:30 AM EDT] It’s a risk-off morning so far.  Equities are declining, Treasury yields are falling and the JPY is appreciating.  The factors hitting risk markets are softer than expected PMI data (see table below) and trade fears.  Here is what we are watching this morning:

China trade: Tomorrow, the administration plans to announce around $50 bn of tariffs and penalties on China, focusing on intellectual property confiscation.  We will be watching to see how the administration acts with China.  The pattern with other trade issues has been to announce dire changes then negotiate to a less aggressive position.  For example, we are seeing some moderation in the NAFTA negotiations.[1]  On the steel tariffs, we are seeing a steady parade of exemptions.  As we have noted before, the president likes flexibility in negotiations; he stakes a position then moderates from there.  Thus, the fear of trade action is reasonable but the actual policy pattern we are seeing, so far, has been less onerous than what’s been announced.  We would expect some threats of retaliation from China.  The most likely targets will be agricultural.

Other central banks: As forecast, the Bank of England didn’t change rates, but the vote was 7-2, with the dissenters calling for a rate hike.  The news led to an initial spike in the GBP and British debt but the former has given up its initial gains.  The PBOC responded to the Fed rate hike by raising its seven-day repo rate by 5 bps to 2.55%, but we suspect this was more for show; the move is small as the repo rate acts as a floor for interbank lending rates.  The actual interbank lending rate is nearly 3.15%, so the impact from the official rise is nil.  However, the optics of not following the Fed, especially with the Trump administration teeing up trade actions, would not have been favorable.

The Fed: As expected, the Fed raised rates by 25 bps.  Growth estimates were increased and the FOMC expects unemployment to fall below 4%.  In the statement, growth was described as “moderate” compared to “solid” in the last statement, likely reflecting the persistent pattern for soft Q1 GDP data.  The dots did move higher.

The red dot is yesterday’s meeting.  We don’t use the median but the average, and we note that the terminal policy rate has increased, with 2020 showing a 3.3% terminal rate.  We also note that the implied yield on the two-year deferred Eurodollar futures is near 3%, suggesting the market is building in further rate hikes in light of this report.  In general, it appears the market expects three hikes this year and three next year, but the risk of even tighter policy is possible.

How did Powell do?  We think rather well.  He answered quickly and directly and referenced the committee on economic questions.  He appeared more comfortable on questions of market liquidity or bank stability.  Financial markets were whipsawed a bit; we suspect there was concern that Powell would make a gaffe and thus there was a good bit of positioning.  But, interest rates eased and equities recovered as the press conference wound down.  What is notable is that the dollar weakened and gold continued to rally.  Although the currency trade is complicated by administration trade policy, the fact that the dollar weakened and gold rallied after the policy change suggests those markets viewed the action as dovish, or at least neutral, and shifted their focus to trade policy.

Energy recap: U.S. crude oil inventories fell 2.6 mb compared to market expectations of a 3.0 mb build.

This chart shows current crude oil inventories, both over the long term and the last decade.  We have added the estimated level of lease stocks to maintain the consistency of the data.  As the chart shows, inventories remain historically high but have declined significantly since last March.  We would consider the overhang closed if stocks fall under 400 mb.

As the seasonal chart below shows, inventories are usually rising this time of year.  This week’s decline is clearly supportive.  Every week that fails to show a build is a week where the seasonal factors become less bearish.  Although there is still time for stockpiles to rise, it is unlikely they will reach their seasonal norms.

(Source: DOE, CIM)

Based on inventories alone, oil prices are undervalued with the fair value price of $64.75.  Meanwhile, the EUR/WTI model generates a fair value of $74.84.  Together (which is a more sound methodology), fair value is $71.56, meaning that current prices are below fair value.  Oil prices rose this week as the DOE data was bullish.  As noted above, we are not seeing the usual seasonal build, which is supportive.  At the same time, rising tensions with Iran are also adding to geopolitical concerns.

View the complete PDF


[1] https://www.wsj.com/articles/nafta-negotiators-signal-progress-on-thorny-auto-content-rules-1521711001

Daily Comment (March 21, 2018)

by Bill O’Grady and Thomas Wash

[Posted: 9:30 AM EDT] It’s Fed day!  Here is what we are watching this morning:

Powell speaks: The Fed meeting concludes today with virtual certainty of a 25 bps rate hike, taking the target to 1.75%.  It should be noted that the target is actually the upper target rate; in reality, the rate that banks are actually charged is the effective rate, which runs in a 25 bps range with the target as the upper end of that band.

This chart shows the upper band, lower band (target -25 bps) and the effective, or actual, fed funds rate.  After the rate increases today, we expect the effective rate, currently around 1.42%, to rise to 1.67%.

This is not the most important issue for today, however.  The two most important issues are (a) what do the dots chart project for this year, and (b) how will Powell do in his first press conference?  Powell is not an economist.  He can’t use technical terms to provide a non-answer to a question.  Our position is that transparency is not a virtue for the Fed.  A Fed chair wants to maintain optionality and clarity works against that.  Therefore, the potential for an unexpected market-moving event is elevated.  Thus, we have been seeing what looks to us as position-squaring in financial markets.  So, this afternoon we will see how Powell does.

Trade: The WSJ[1] is reporting that although the Trump administration is planning on unveiling tariffs on China this Friday, the reality is that nothing will be implemented immediately.  The president clearly wants to use tariffs as bargaining chips.  As we have mentioned before, if he simply wants to narrow the trade deficit through direct action, he should have supported the border adjustment tax.  That would have been effective but it also would have restricted his ability to negotiate because he would have had nothing to use as “carrots and sticks.”  For the financial markets, the trend in trade policy is not helpful, but the specifics are, for the most part, rather benign.  In related news, the G-20 was unable to agree on a trade consensus; most nations wanted the U.S. to commit to a multilateral trade regime which the administration rejects on principle.

View the complete PDF


[1] https://www.wsj.com/articles/trump-to-ramp-up-trade-restraints-on-china-1521593091

Daily Comment (March 20, 2018)

by Bill O’Grady and Thomas Wash

[Posted: 9:30 AM EDT]

Framing the Fed: The FOMC meeting begins today.  Here we lay out the basic path for monetary policy.

The chart on the left shows the implied three-month LIBOR rate, two years deferred, derived from the Eurodollar futures market.  Note that the yield has increased dramatically since mid-2017, coinciding with optimism and then the passage of the tax bill.  The chart on the right compares that rate to the fed funds target, with the spread between the two rates shown on the upper line of the chart.  In general, LIBOR rates exceed fed funds (fed funds have less credit risk), but the two rates do become a good guidepost for policy.  We have set vertical lines where the two lines cross.  Usually, this marks the end of a tightening cycle.  The Greenspan Fed seemed to closely watch this rate and stopped raising rates when the implied rate fell below fed funds.

The current spread indicates the FOMC will raise rates another 150 bps, to a terminal rate of 3.00%, in two years.  Assuming 25 bps per hike, that implies seven more increases before this time in 2020.  That could mean three hikes this year and four in the remaining 15 months, or four this year and three in the last 15 months.  The number for this year is the topic of discussion.  We expect a clear signal for three and the potential for an additional hike.  It is worth noting that it was not unusual in previous tightening cycles for the implied rate to decline to the target.  Thus, we may not make it to 3.00%.  However, for that to happen, the implied rate will need to decline at some point.

The other issue is that this meeting will be the first press conference for Chair Powell.  A number of pundits have applauded the new Fed leader for speaking plainly.  This is not actually a virtue in our estimation.  Clarity in policy dampens fear and encourages investors to take on more risk until financial markets become unstable.  Thus, a little obscurity should be welcomed.

The prince is in Washington: Saudi Crown Prince (CP) Mohammed bin Salman is visiting the U.S. capital today.  There are a number of items on his agenda, including an attempt to pull the U.S. into a harder line on Iran and likely feeling out policymakers for their reaction to the Kingdom of Saudi Arabia (KSA) acquiring nuclear power.  CP Salman would like to diversify the KSA’s energy away from hydrocarbons, but getting nuclear reactors could give the country the infrastructure to develop indigenous nuclear weapons.  The harder line on Iran should be a bit like pushing an open door—the nomination of Pompeo to the State Department puts an Iran hawk in place and the president has been consistently critical of the Iranian nuclear deal.  In May, the president has to recertify the Iran deal and there is growing speculation he won’t do so.  Finally, the KSA is considering limiting the listing of its Saudi Aramco IPO to the Saudi equity market only.  We suspect the KSA doesn’t want to tackle the intrusive reporting requirements of London or New York.  However, we would not count out Beijing as it would not be a shock to see China offer placement for the IPO and wave Western-level compliance.  Concerns surrounding Iran may be behind the rise in oil prices today.

More Facebook (FB, 172.56) fallout: Shares are lower again this morning as the company struggles to get in front of the fallout from the Cambridge Analytica scandal.  Perhaps the most interesting development is that Democrats are turning on the company.[1]  Generally speaking, industry groups line up politically and technology has tended to land with Democrats.  The extractive industries and much of manufacturing has been captured by the GOP, while the financial sector tends to be divided between both parties.  The Democrats are angry that Facebook may have assisted the GOP during the presidential election and are thinking of exacting revenge.  If this broadens to the entire sector it may affect donation flows for the upcoming mid-terms and the 2020 presidential race.

China trade issues: It appears the president is poised to impose some $60 bn in tariffs against Chinese products on Friday.[2]  So far, China appears to be following two tracks on this issue.  First, China is trying to be conciliatory; Premier Li Keqiang promised in a speech at the end of the National Party Congress to do more to protect intellectual property.[3]  Chairman Xi’s top economic advisor, Liu He, told a group of business leaders that he intends to takes steps to open up China’s economy.[4]  It appears China is trying to manage the relationship and avoid an all-out trade war; however, President Trump seems to be spoiling for a fight.  Second, if a trade war does start, look for China to attack U.S. agriculture.

View the complete PDF


[1] https://www.politico.com/story/2018/03/19/angry-democrats-facebook-424456

[2] https://www.washingtonpost.com/business/economy/trump-prepared-to-hit-china-with-60-billion-in-annual-tariffs/2018/03/19/fd5e5874-2bb7-11e8-b0b0-f706877db618_story.html?utm_term=.33ce92d9800c

[3] https://www.bloomberg.com/news/articles/2018-03-20/china-to-open-manufacturing-cut-tariffs-and-taxes-premier-says

[4] https://www.bloomberg.com/news/articles/2018-03-02/top-xi-aide-is-said-to-promise-u-s-ceos-action-on-china-reforms, https://www.reuters.com/article/us-china-parliament/chinas-premier-hopes-trade-war-can-be-averted-pledges-more-open-economy-idUSKBN1GW0AO

Weekly Geopolitical Report – The North Korean Summit: Part I (March 19, 2018)

by Bill O’Grady

On March 8, officials from South Korea, including Chung Eui-yong, the director of South Korea’s National Security Office, came to Washington to brief U.S. officials on a recent dinner with Kim Jong-un, the leader of North Korea.  The dinner was held in Pyongyang at North Korea’s Workers’ Party Headquarters, Kim’s workplace, where Mr. Chung and Suh Hoon, the National Intelligence Service director, were joined by Kim and his sister.  This event marked the first time that South Korean officials had been inside North Korea’s Communist Party headquarters since the Korean War.

According to reports, the dinner meeting was a surprising success.  Kim was said to be warm and open.[1]  He proposed a hotline between the two Koreas and a summit meeting with himself and South Korean President Moon Jae-in.  Kim also wanted the South Koreans to send a message to Washington that the North Korean leader would like a summit meeting with President Trump.

As the South Korean delegation was meeting with Trump administration officials on March 8, President Trump made an unscheduled appearance; he was scheduled to meet with the South Koreans the next day.  At this meeting, the South Koreans informed the American president of Kim Jong-un’s desire to have a meeting and President Trump immediately agreed.

This decision was a shock and set off a plethora of uncertainties.  This would be the first time since the creation of North and South Korea that a sitting American president has met directly with the leader of North Korea.  It appears the State Department was not aware of the invitation or the acceptance.  U.S. allies, such as Japan, were not warned and major powers in the region, such as China, were also informed after the fact.

So, in the matter of a few months, we have moved from fears of war to an unprecedented meeting.  This meeting is a high stakes wager; if the summit fails to improve relations between the U.S. and North Korea, it isn’t clear how the path forward doesn’t include war.  At the same time, if it works, Trump will have resolved one of the most intractable problems in American foreign policy.

In this week’s report, we will discuss the geopolitical goals, constraints and meeting positions of the major regional parties.  Next week, we will examine why the talks have been proposed now.  We will then offer the reasons why the talks may fail or succeed.  We will summarize the costs and benefits from the summit meeting and conclude with market ramifications.

The Players
There are six nations involved in the North Korean issue—North Korea, South Korea, China, Japan, Russia and the U.S.  We will cover the geopolitical goals, constraints and meeting concerns of each country.

View the full report


[1] https://www.wsj.com/articles/north-koreas-kim-jong-un-was-jocular-and-at-ease-at-boozy-banquet-1520606867

Daily Comment (March 19, 2018)

by Bill O’Grady and Thomas Wash

[Posted: 9:30 AM EDT] Happy Monday!  We are seeing weaker equity markets and rising Treasury yields this morning.  There is a lot going on—let’s dig in:

A Brexit deal: Negotiators for the U.K. and EU have announced they mostly have an agreement in place.  Although some problems remain unresolved, mostly the Ireland/Northern Ireland frontier, both sides have made significant progress on an exit agreement.  The GBP jumped on the news and is holding its gains as further details become available.  The currency market reaction does suggest this outcome was not expected.

Mueller worries: Financial markets, for the most part, have ignored the personnel news out of the White House.  There have been one-day blips surrounding significant departures, such as Gary Cohn, but they generally haven’t started a trend.  Overnight, we saw another downward drop, seemingly tied to a series of Twitter quotes suggesting the president may dismiss Robert Mueller.  This area may be a red line.  The AG can fire Mueller[1] but the president, at least directly, cannot.  This is dangerous ground for the president.  Firing Mueller will raise the “taint” of scandal even if one doesn’t exist.  If Mueller is forced out, it could trigger a constitutional crisis that would likely affect investor sentiment.  As we note in this week’s Asset Allocation Weekly Comment (see below), the “misery index” P/E model suggests the S&P is fairly valued and equities should do better if earnings continue on their current path.  However, P/Es are always vulnerable to sentiment shocks and such a crisis might trigger one.  It does appear the White House is trying to ease tensions as recent tweets suggest no action will be taken against Mueller, but that hasn’t lifted equities yet.

A new PBOC Chief: After 15 years as governor of the People’s Bank of China, Zhou Xiaochuan has retired, passing on the position to Yi Gang.  Yi is a Western-educated economist with 20 years of central banking experience.  He should be considered a continuity candidate.  Yi is committed to financial reform and, like his predecessor, wants to see debt levels reduced.  However, the PBOC, like nearly everything in China, is not independent of the CPC.  Although there is broad agreement between the CPC and PBOC on the need to delever, the former always loses its nerve when it becomes apparent that such actions will slow economic growth.  We see no reason for this to change in the near term, although Chairman Xi has amassed enough power to press for this significant change.  In fact, if he fails to bring lower debt growth, it begs the question as to why he bothered to gather such control.

Problems at Facebook: In this report, we don’t comment on individual companies unless the news surrounding them has macro implications.  Facebook (FB, 185.09) is down sharply in the pre-market trade after several articles in the U.S. and Britain suggested the company was either duped or willfully negligent during the 2016 election.  Cambridge Analytica was able to gain access to personal data for the social media firm’s users and the company used this information to directly target potential voters.  Using technology to receive news from political organizations is nothing new.  However, if the data was gained without authorization, it likely violates privacy rights of users and is a potential risk for the company.  Given that “big tech” has been a major support to the equity markets, a large decline in one of these companies will tend to have outsized effects on the overall equity market, which is why this issue bears watching.[2]

Putin wins!  In a weekend of historic upsets, one outcome was never in doubt—Vladimir Putin won another six-year term as president.  What he intends to do with this power is uncertain but, in a clearly rigged election (there were no real alternatives in the election), the real issue was turnout.  It looks like about 65% of eligible voters cast ballots, which isn’t bad but not the 70% Putin was hoping for.

OECD boosts growth forecasts: The G-20 meets this week.  This group has become so unwieldy that it doesn’t really function as a policy group.  However, the OECD does put out forecasts before the meetings and it lifted its global GDP growth forecast to 3.9% for this year and next year, the highest growth forecast since 2011.  The group did warn that trade restrictions would weigh on growth if they become widespread.

A shutdown on Friday?  Congress is preparing to send a budget to the president this week.  He needs to sign it by Friday or the government will shut down.  The bill, introduced last month, will increase spending and not necessarily meet the goals of the administration on all spending priorities.  Will the president, who has become increasingly mercurial lately, simply refuse to sign the measure?  Although this outcome isn’t on investors’ radar screens, there is a chance that we won’t have an agreement and a shutdown will occur.  If this occurs, expect some weakness in equities and a decline in Treasury yields.

The Fed: The FOMC also meets this week.  Fed funds futures put the likelihood of a 25 bps hike at 99.3%, with a 0.7% chance of 50 bps.  We will have more on this tomorrow but policy concerns are likely weighing on financial markets today.

View the complete PDF


[1] This is true under normal circumstances.  However, the sitting AG has recused himself from the Russian investigation, meaning one of his deputies would actually have to fire Mueller.  Nixon faced the same problem when he wanted to fire Archibald Cox.  Two officials resigned before Robert Bork did the firing. See: https://en.wikipedia.org/wiki/Saturday_Night_Massacre

[2] Here are some relevant articles: https://www.cnbc.com/2018/03/18/facebook-failing-zuckerberg-and-sandberg-absent-commentary.html?utm_source=newsletter&utm_medium=email&utm_campaign=newsletter_axiosam&stream=top-stories ; https://www.nytimes.com/2018/03/17/us/politics/cambridge-analytica-trump-campaign.html?hp&action=click&pgtype=Homepage&clickSource=story-heading&module=first-column-region&region=top-news&WT.nav=top-news ; https://www.bloomberg.com/news/articles/2018-03-19/facebook-s-zuckerberg-under-pressure-to-answer-for-data-breach?utm_source=newsletter&utm_medium=email&utm_campaign=newsletter_axiosam&stream=top-stories ; https://www.cnbc.com/2018/03/18/whistleblower-christopher-wylie-says-hes-now-been-blocked-by-facebook.html ; https://www.ft.com/content/7ed1572c-2aa4-11e8-a34a-7e7563b0b0f4?emailId=5aaf3a4f92ba4800049585ec&segmentId=22011ee7-896a-8c4c-22a0-7603348b7f22 ; https://www.theguardian.com/news/2018/mar/17/data-war-whistleblower-christopher-wylie-faceook-nix-bannon-trump?CMP=share_btn_tw&wpisrc=nl_todayworld&wpmm=1 ; https://www.nytimes.com/2018/03/18/us/cambridge-analytica-facebook-privacy-data.html?emc=edit_mbe_20180319&nl=morning-briefing-europe&nlid=5677267&te=1

Asset Allocation Weekly (March 16, 2018)

by Asset Allocation Committee

Last week, we discussed the fact that the generally strong economy should be supportive for equity markets as economic growth will tend to support earnings.  However, the other important element of equity valuation is what multiple investors put on those earnings.  The most common valuation metric is the price/earnings ratio (P/E).  Our equity market forecast is based upon expectations for earnings and the multiple investors put on those earnings.

This week we will discuss modeling the multiple.  The most common way to estimate the P/E is to compare it to the 10-year T-note yield.  This is known as the “Fed model” on the idea that the P/E represents the “yield” on equities.[1]

The chart on the left shows the 10-year yield and the S&P earnings yield from 1960.  There have been periods when the two series moved closely together—the early 1980s into 2002 is notable.  However, there have been significant deviations as well, such as the mid-1970s and the past 15 years.  The chart on the right shows a regression model of the earnings yield using the T-note yield.  The variation is rather wide; in addition, the model suggests equity markets were mostly overvalued from the 1980s into 2000.

The primary argument for the Fed model is that portfolios tend to be constructed of equities and fixed income.  Thus, measuring the relative valuation between these two assets makes sense.  However, it also has some serious weaknesses.  First, there are different motivations for owning each asset.  One buys equities to own a portion of the productive capacity of the nation’s economy.  Owning fixed income gives one a return for forgoing current consumption.  Thus, it would make sense for someone to buy equities when they are upbeat about the future; equities are the asset for optimists.[2]  Treasuries, on the other hand, are serviced by the taxing power of the U.S. government.  The risk of equity earnings is fundamentally different than that of Treasuries.  Second, it’s a relative valuation model.  Consequently, during periods when there is a deviation from fair value, it’s hard to know which market is “out of whack.”

Another way of looking at equity valuation is relative to the economy.  The trick is which combination of economic variables has the most explanatory power?  Earnings are, in part, a function of economic growth, and inflation determines the “real” value of those earnings.  A classic indicator that captures both economic activity and inflation is the “misery indicator,” which is the sum of the unemployment rate and the yearly change in inflation.  Created by the Nobel Laureate Arthur Okun, it is designed to measure the degree of “pain” from a weak economy and inflation.

The misery index is clearly inversely correlated to the P/E.  The unemployment rate is an indicator of overall economic health and inflation is, to a great extent, a measure of the relative attractiveness of real assets compared to financial assets.  Although the misery index model isn’t perfect, it gives rather consistent results and generally offers better signals of valuation—in other words, it suggests periods when the market is overvalued or undervalued, whereas the Fed model tends to have longer swings in valuation.  On the other hand, the misery index has one significant flaw—it would not work well during periods of deflation as it would be signaling improvement when, in fact, deflation tends to occur during periods of economic turmoil.

Both models suggest the current P/E is not excessive.  We expect unemployment to remain low and inflation contained, which should mean the misery index model would support equities.  Additionally, the Fed model indicates that the recent rise in yields has simply reduced the undervaluation of equities.  Thus, we remain bullish equities despite recent turmoil.

View the PDF


[1] The inverse of the P/E is the “earnings yield.”

[2] However, buying equities when one is hopeful about the future might not be the best investment plan; history suggests buying equities when times are dire may actually be more prudent because they tend to be less expensive.

Daily Comment (March 16, 2018)

by Bill O’Grady and Thomas Wash

[Posted: 9:30 AM EDT] Happy Friday!  Here is what we are watching this morning:

The shakeup continues:  Numerous media sources indicate that Gen. McMasters is on his way out as National Security Director.  The most rumored replacement is John Bolton, a well-known hawk.  If Bolton does get the job, the odds increase significantly that the Iran nuclear deal gets overturned.  Bolton and Pompeo are harsh critics of the Iran deal and would support the president’s instincts to break it.  Iran’s reaction will be interesting to watch.  The pragmatists, led by President Rouhani, would be under tremendous pressure from the hardliners, who are also critical of the pact.  It all comes down to the Supreme Leader, Ayatollah Khamenei, who approved the original treaty.  We suspect he has never trusted the U.S. and would view a treaty break as just another example of American duplicity.  It is possible the Trump administration thinks it can negotiate a new deal with Iran.  Maybe he can, but it is more likely that Iran will dump the deal and rush to build a nuclear weapon.  This leads to two possible outcomes, both bad.  First, we note that the Saudi crown prince indicated that if Iran gets a nuke, the kingdom will acquire one too.[1]  Nuclear proliferation in an unsettled part of the world is not a good outcome.  Second, if Iran does “go for nuclear,” Israel would likely view this as an existential threat.  Although its first choice would be for the U.S. to fight Iran, if Netanyahu determines that isn’t going to happen he may decide to attack Iran directly.  The most likely response would be a nuclear first strike; Iran’s nuclear program is too large and dispersed to be successfully attacked with Israel’s conventional forces.  Although we are still a ways from this worst case scenario, the trends are not looking favorable.  From our standpoint, all this points to the potential for a supply disruption in the energy markets.

Cyberattacks: The Trump administration is accusing Russia of a series of cyberattacks on the U.S. and Europe that targeted key infrastructure of electric and water systems.  Apparently, this gave Russian hackers control of these systems and, if triggered, the attacks could have caused a power shutdown.[2]  The NYT[3] is also reporting that a cyberattack on a Saudi petrochemical facility appears to have been designed to cause an explosion at the plant and the only reason it didn’t work was because the undisclosed attackers made errors in their computer code.  Their errors inadvertently shut down the plant before the more deadly aim of sabotage could take place.  The West does appear to be mobilizing against Russia.  New sanctions have been announced but we will be watching for Western cyberattacks on Russia.  In the current environment, nations are engaging in belligerent acts that essentially come just short of triggering a war response.  For example, China’s militarizing shoals in the South China Sea, Russia’s annexation of Crimea, Abkhazia, South Ossetia and parts of Ukraine, undermining the democratic process in the West and cyberattacks are all elements of this “hybrid war.”  At some point, the West will need to respond.  How it responds will be important.  If a Cold War model is adopted, look for the West to try to isolate China and Russia.

More trouble for Abe: Polls show that PM Abe’s support is down to 39%, a nearly 9.5% point drop, as the land scandal will simply not go away.  Although Abe continues to indicate he won’t resign, if it becomes apparent his position is untenable the end of Abe means the end of Abenomics.  That outcome will likely bring a stronger JPY.

A couple of economy concerns: Although we don’t see signs of recession, there are some signs of slower growth.

The Atlanta FRB’s GDPNow forecast for Q1 has fallen rather precipitously.  They haven’t updated their contributions to their model so we can’t yet pinpoint where the weakness is coming from, but it appears weakening consumption is weighing on growth.  Q1 GDP has had a seasonal adjustment problem; over the past four years, Q1 has been weaker than trend in three of those years.  In addition, we should see a boost in consumption as the effects of the new tax law on withholding are implemented.  Still, this drop in growth with the Fed raising rates is a worry.

In addition, the yield curve has been flattening again.

(Source: Bloomberg)

After steepening last month, the curve has rapidly flattened to nearly the lows seen in early January.  Some of this is because German Bund yields have declined.  Nevertheless, the flattening should be a signal to policymakers to exercise caution.

View the complete PDF


[1] https://www.nytimes.com/2018/03/15/world/middleeast/mohammed-bin-salman-iran-hitler.html?emc=edit_mbe_20180316&nl=morning-briefing-europe&nlid=5677267&te=1

[2] https://www.nytimes.com/2018/03/15/world/middleeast/mohammed-bin-salman-iran-hitler.html?emc=edit_mbe_20180316&nl=morning-briefing-europe&nlid=5677267&te=1

[3] https://www.nytimes.com/2018/03/15/technology/saudi-arabia-hacks-cyberattacks.html?emc=edit_mbe_20180316&nl=morning-briefing-europe&nlid=5677267&te=1