Asset Allocation Weekly (March 16, 2018)
by Asset Allocation Committee
Last week, we discussed the fact that the generally strong economy should be supportive for equity markets as economic growth will tend to support earnings. However, the other important element of equity valuation is what multiple investors put on those earnings. The most common valuation metric is the price/earnings ratio (P/E). Our equity market forecast is based upon expectations for earnings and the multiple investors put on those earnings.
This week we will discuss modeling the multiple. The most common way to estimate the P/E is to compare it to the 10-year T-note yield. This is known as the “Fed model” on the idea that the P/E represents the “yield” on equities.[1]
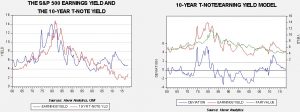
The chart on the left shows the 10-year yield and the S&P earnings yield from 1960. There have been periods when the two series moved closely together—the early 1980s into 2002 is notable. However, there have been significant deviations as well, such as the mid-1970s and the past 15 years. The chart on the right shows a regression model of the earnings yield using the T-note yield. The variation is rather wide; in addition, the model suggests equity markets were mostly overvalued from the 1980s into 2000.
The primary argument for the Fed model is that portfolios tend to be constructed of equities and fixed income. Thus, measuring the relative valuation between these two assets makes sense. However, it also has some serious weaknesses. First, there are different motivations for owning each asset. One buys equities to own a portion of the productive capacity of the nation’s economy. Owning fixed income gives one a return for forgoing current consumption. Thus, it would make sense for someone to buy equities when they are upbeat about the future; equities are the asset for optimists.[2] Treasuries, on the other hand, are serviced by the taxing power of the U.S. government. The risk of equity earnings is fundamentally different than that of Treasuries. Second, it’s a relative valuation model. Consequently, during periods when there is a deviation from fair value, it’s hard to know which market is “out of whack.”
Another way of looking at equity valuation is relative to the economy. The trick is which combination of economic variables has the most explanatory power? Earnings are, in part, a function of economic growth, and inflation determines the “real” value of those earnings. A classic indicator that captures both economic activity and inflation is the “misery indicator,” which is the sum of the unemployment rate and the yearly change in inflation. Created by the Nobel Laureate Arthur Okun, it is designed to measure the degree of “pain” from a weak economy and inflation.
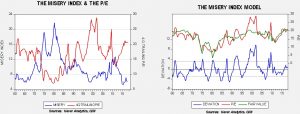
The misery index is clearly inversely correlated to the P/E. The unemployment rate is an indicator of overall economic health and inflation is, to a great extent, a measure of the relative attractiveness of real assets compared to financial assets. Although the misery index model isn’t perfect, it gives rather consistent results and generally offers better signals of valuation—in other words, it suggests periods when the market is overvalued or undervalued, whereas the Fed model tends to have longer swings in valuation. On the other hand, the misery index has one significant flaw—it would not work well during periods of deflation as it would be signaling improvement when, in fact, deflation tends to occur during periods of economic turmoil.
Both models suggest the current P/E is not excessive. We expect unemployment to remain low and inflation contained, which should mean the misery index model would support equities. Additionally, the Fed model indicates that the recent rise in yields has simply reduced the undervaluation of equities. Thus, we remain bullish equities despite recent turmoil.
[1] The inverse of the P/E is the “earnings yield.”
[2] However, buying equities when one is hopeful about the future might not be the best investment plan; history suggests buying equities when times are dire may actually be more prudent because they tend to be less expensive.


