by Bill O’Grady, Thomas Wash, and Patrick Fearon-Hernandez, CFA | PDF
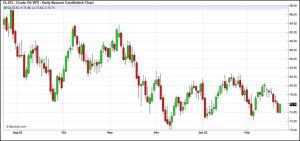
Crude oil remains in a trading range between $72-$82 per barrel.
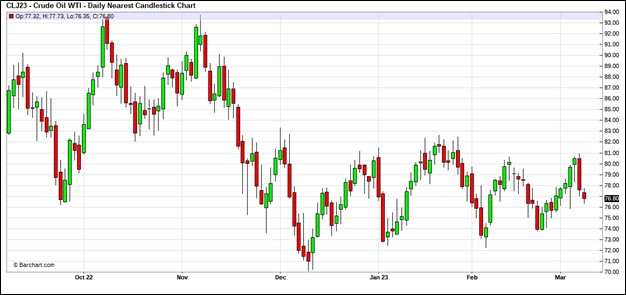
(Source: Barchart.com)
Crude oil inventories fell 1.7 mb compared to a 1.9 mb build forecast. The SPR was unchanged.
In the details, U.S. crude oil production declined 0.1 mbpd to 12.2 mbpd. Exports fell 2.3 mbpd, while imports rose 0.1 mbpd. Refining activity rose 0.2% to 86.0% of capacity.
(Sources: DOE, CIM)
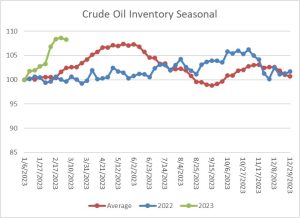
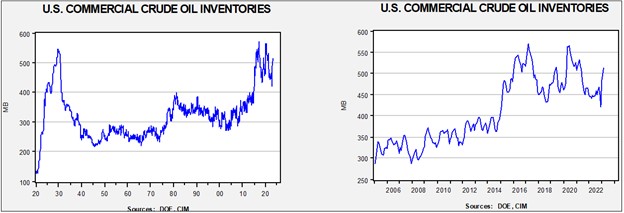
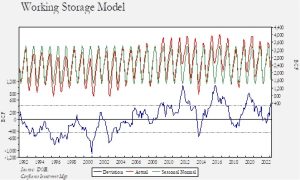
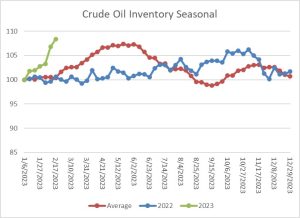
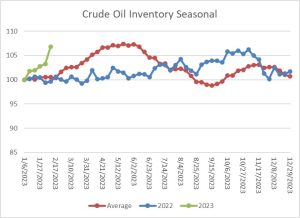
The above chart shows the seasonal pattern for crude oil inventories. We have been accumulating oil inventory at a rapid pace, even without SPR sales. This week, while there was a modest drop in inventory, we remain well above normal seasonal levels.
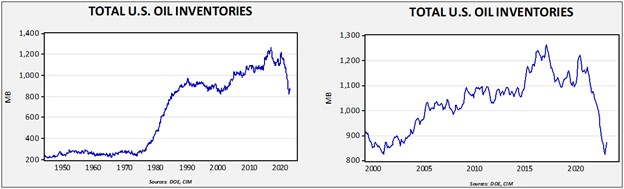
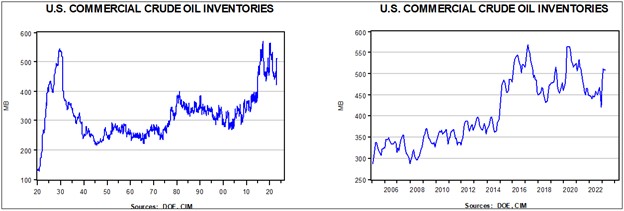
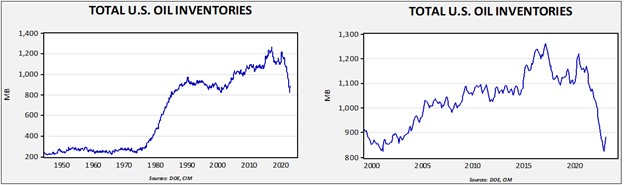
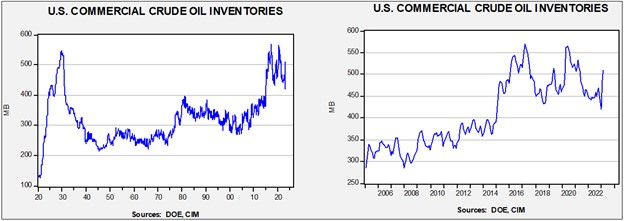
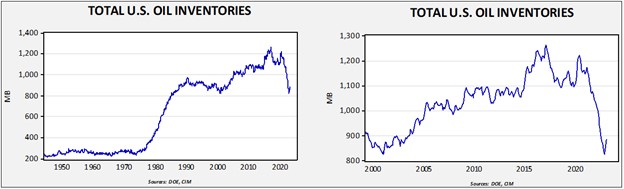
Since the SPR is being used, to some extent, as a buffer stock, we have constructed oil inventory charts incorporating both the SPR and commercial inventories. With another round of SPR sales set to happen, the combined storage data will again be important.
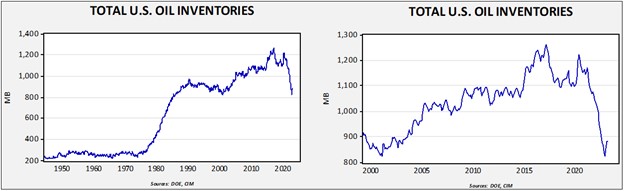
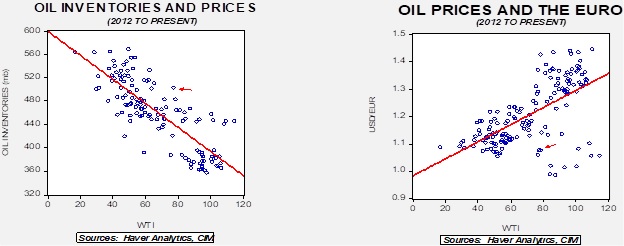
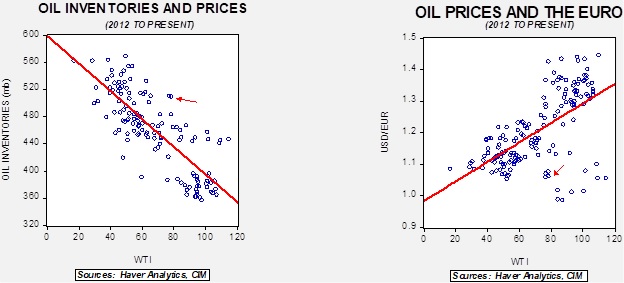
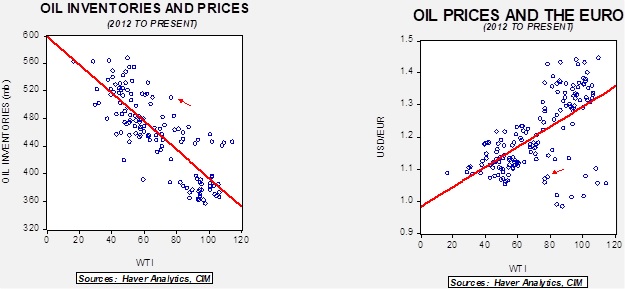
Total stockpiles peaked in 2017 and are now at levels last seen in 2001. Using total stocks since 2015, fair value is $93.31.
The Unaccounted Problem
The DOE’s weekly report is a combination of survey data and estimates. Although traders focus on the weekly reports, the government views the monthly reports as the most accurate. Unfortunately, the monthly reports are issued with a two-month lag. For practical purposes then, the weekly data, though imperfect, is what moves markets.
Line 13 of the petroleum supply section of the petroleum balance sheet is a plug number called “adjustment.” It was previously called “unaccounted for crude oil” as it balances the known sources of crude oil (production, net imports, stock change) with the level of crude oil consumed by the domestic refining industry. Lately, this number has been rising.
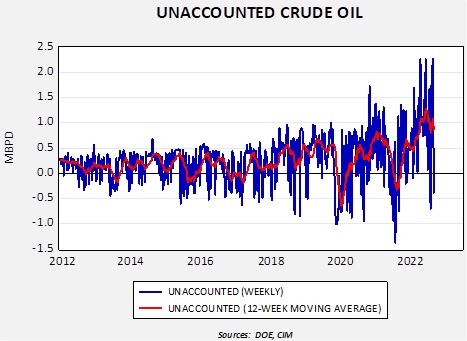
When the reading is above zero, it indicates that more crude oil was refined that week than was identified in the surveys or estimates. What we know is that there is more crude oil (and/or associated products) available, but what is being missed is quite important. The DOE argues that blending components used by refiners are possibly being included in the count of crude oil. However, it is also possible that (a) production is higher than estimated since production in the lower 48 is an estimate, (b) imports are higher, (c) exports are lower, or (d) there is more oil being moved from inventory. Obviously, how this unaccounted crude oil is accounted for matters a great deal. Our guess is that it’s likely a combination of blending stocks being counted as crude oil and, perhaps, lower exports. In any case, the monthly numbers should provide some clarity…in May.
Market News:
- The Columbia University Center on Global Energy Policy released a report on investing in a market that is transitioning away from fossil fuels. The report notes that not only are investments in oil and gas production falling, but the investments still occurring are increasingly being made by state-owned oil companies, most of which are in the Middle East. The private sector isn’t investing for several reasons, one of which is a history of low returns in the industry as investors are demanding better returns. If these trends continue, it suggests that oil prices will tend to be elevated even as demand weakens. The CEO of Saudi Aramco (2222, SAR, 34.95) warns that persistent underinvestment will keep oil supplies tight.
- U.S. LNG is filling the gap caused by the end of Russian natural gas sales to Europe. The EU is moving to consolidate purchases in a bid to lower prices.
- It’s CERA week in Houston. One of the key topics is the lack of spare capacity in oil production. Another important item emerged from the shale patch which warned that the best days may be behind the industry, meaning that OPEC+ can reassert control over oil prices.
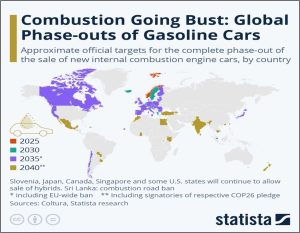
- This map shows European fuels of choice for electricity production.
- The DOE is preparing to refill the SPR…next year.
Geopolitical News:
- We have been monitoring the ongoing speculation surrounding the sabotage of the Nord Stream pipelines. A recent New York Times article suggests that a Ukrainian group, not directly affiliated with the government, was likely responsible. Although Seymour Hersh caused a stir recently when he suggested that it was a U.S.-led attack, most analysts felt that Ukraine had the strongest incentive to carry out this attack. If the Ukrainians turn out to be responsible, it would adversely affect the country’s relations with Germany. A proxy group would give Ukraine plausible deniability, which would help with this issue. As expected, the Ukrainian government has denied responsibility.
- Russia has decided to mothball the remaining parts of the Nord Stream 1 & 2 in light of last year’s sabotage.
- This week’s BWGR discusses the potential emergence of a “petroyuan” structure to create an alternative to the dollar/Treasury reserve system. Reports indicate that Russian oil exports are being paid in a variety of currencies. Since Russia has been excluded from the dollar system, it makes sense that Moscow would accept various currencies for payment. On an interesting note, even the use of other currencies hasn’t been completely successful in avoiding U.S. sanctions. Some sort of digital payment mechanism will likely be required in order to avoid the U.S. banking system completely.
- There has been a spate of apparent poisonings in Iran, which seem to be targeting girls’ schools. It is not clear whether these attacks are related to the hijab protests or are coming from elements in the Taliban who oppose educating women.
- Iran is promising to cooperate with the IAEA after the recent findings of enriched uranium particles at near-weapons-grade levels. The fact that Tehran is trying to at least portray it is working with the IAEA suggests that it is not ready to declare itself a nuclear power.
- Iran announced that the “questions” of enrichment have been answered, although the IAEA hasn’t confirmed this assertion.
- On the other hand, Iran has agreed to reinstall monitoring cameras at its nuclear facilities.
- Interestingly enough, the U.S. has not responded strongly to the news of enrichment, while Europe, on the other hand, has been calling for censure.
- The U.S. fears that Iran is using Iraq to acquire dollars and evade sanctions. In response, the Treasury Department is tightening transfers. Unfortunately, this decision is adversely affecting Iraq’s economy.
- Russian tax revenue from oil and gas sales fell 48% in February. Lower prices and reduced volume led to the drop.
- Uzbekistan is reluctantly turning to Russia for natural gas.
- Russia is exporting oil to the UAE, and it is likely that this oil is being “laundered” for sale to areas that are observing sanctions on Russia.
- As Russia and Iran draw closer, the Gulf Nations and Israel are pressing Moscow not to sell arms to Tehran. Russia, like China, has been trying to woo all parties in the Middle East, but it is finding that deep divisions exist. Although both China and Russia have interests in developing closer relations with Iran, building a coalition will, almost by necessity, exclude the Gulf States and Israel. As Europe and the U.S. have learned over the years, managing differences in the region is difficult. At the same time, the U.S. is expressing greater concern over the growing Iranian/Russian ties.
- The Kingdom of Saudi Arabia has sent $5 billion to Turkey to bolster Ankara’s foreign reserves.
Alternative Energy/Policy News:
- The IEA released its CO2 emissions report for 2022. Although emissions reached a new record high, the pace of emissions growth is actually declining.
- Carbon capture projects are continuing to develop, but the pipelines that carry CO2 to storage are unregulated at this point.
- Agroforestry is the practice of planting trees around farm fields. The idea is that the trees will help prevent soil erosion and can provide shelter for livestock. Government funding for increasing agroforestry is being considered.
- The anti-ESG movement has begun to target insurance companies that may be denying coverage due to climate change concerns. The industry is pushing back, but it may be impossible for the government to force firms to cover areas adversely affected by climate issues.
- In the early days of the auto industry, firms often attempted to vertically integrate operations. As the industry matured, it decentralized, which led to multiple firms supplying all sorts of inputs. Due to insecurity of supply, EV makers are attempting to follow the early founders of car manufacturers by vertically integrating.
- Volkswagen (VWAGY, $18.99) will build a battery plant in North America to take advantage of the subsidies offered by the Inflation Reduction Act. This news will likely trouble EU policymakers, who have been critical of the “buy American” elements of the act.
- One of the problems with the transition to clean energy is that China dominates the production of the needed components. As the world devolves into blocs, the U.S.-led bloc may, in the short run, either continue to use fossil fuels or import clean energy components from China.
- China is reportedly building “breeder” nuclear reactors. Although such reactors can be used to generate power, they also create plutonium which can be used for nuclear weapons.
- Geothermal power is attracting attention from industry and government.
- Environmentalist groups have been trying to curb oil and gas production by restricting pipeline expansion. Data from the DOE suggests that they were remarkably successful. Meanwhile, oil companies are preparing the groundwork needed to acquire subsidies for investments in carbon capture.


 (Sources: DOE, CIM)
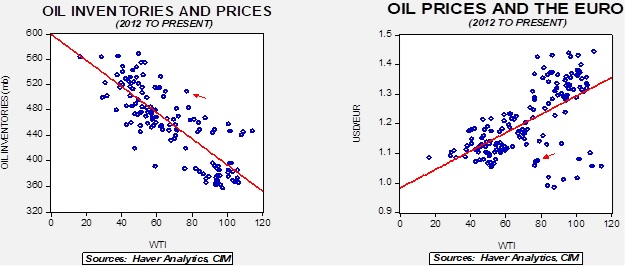

 (Sources: DOE, CIM)