by Bill O’Grady, Thomas Wash, and Patrick Fearon-Hernandez, CFA | PDF
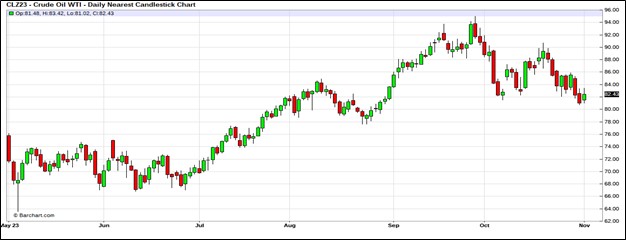
Crude oil prices have retreated from their early October highs.
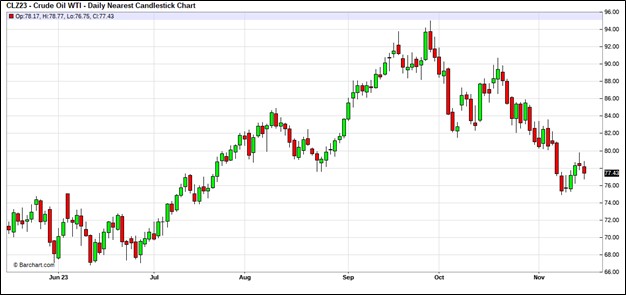 (Source: Barchart.com)
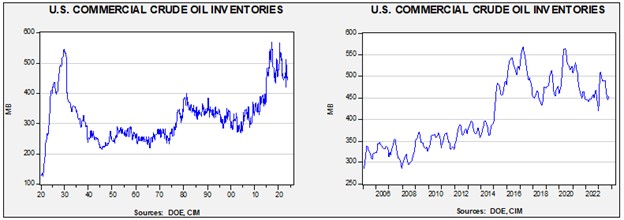
Commercial crude oil inventories rose 0.8 mb compared to forecasts of a 2.0 mb build. The SPR was unchanged, which puts the net build at 0.8 mb.
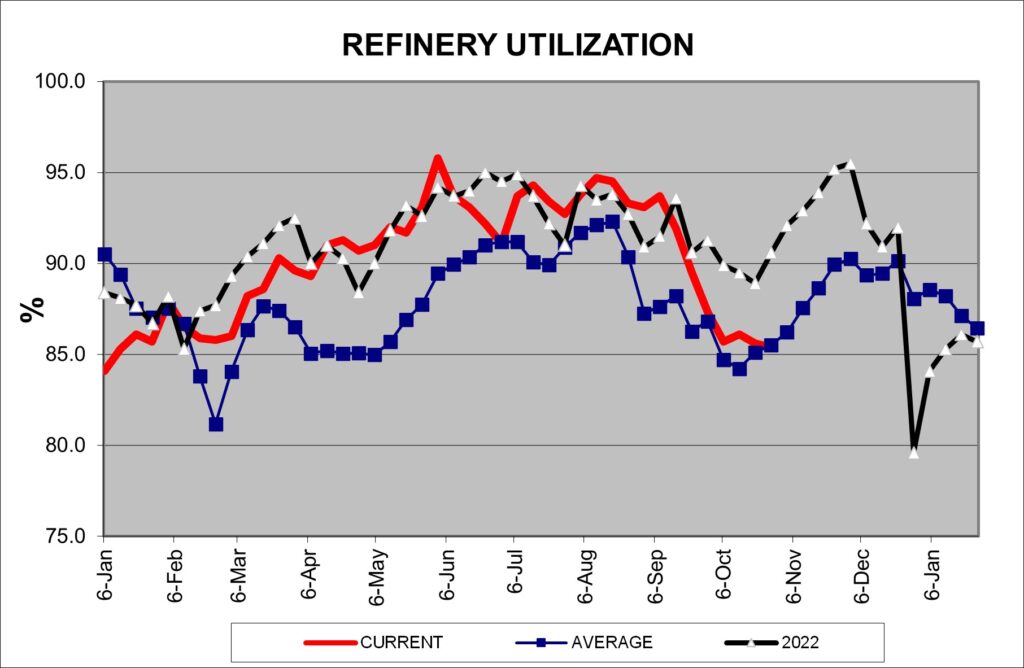
In the details, U.S. crude oil production was steady at 13.2 mbpd. Exports rose 0.4 mbpd, while imports were unchanged. Refining activity rose 0.9% to 86.1% of capacity. Refinery activity has started its seasonal recovery which should last into December.
 (Sources: DOE, CIM)
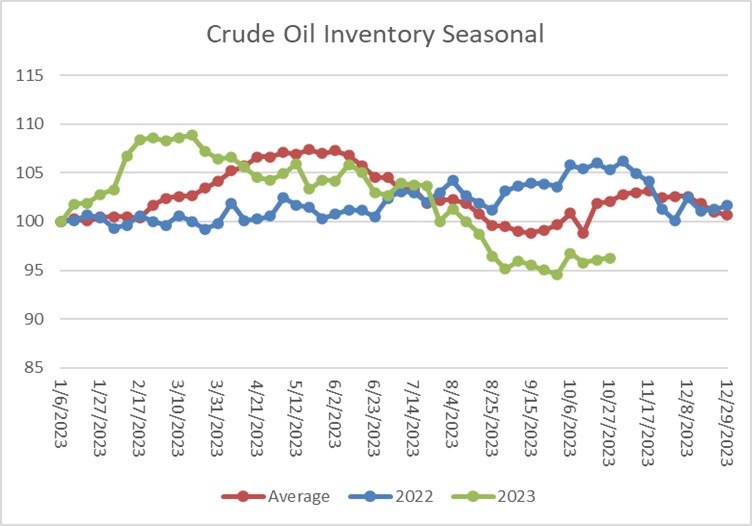
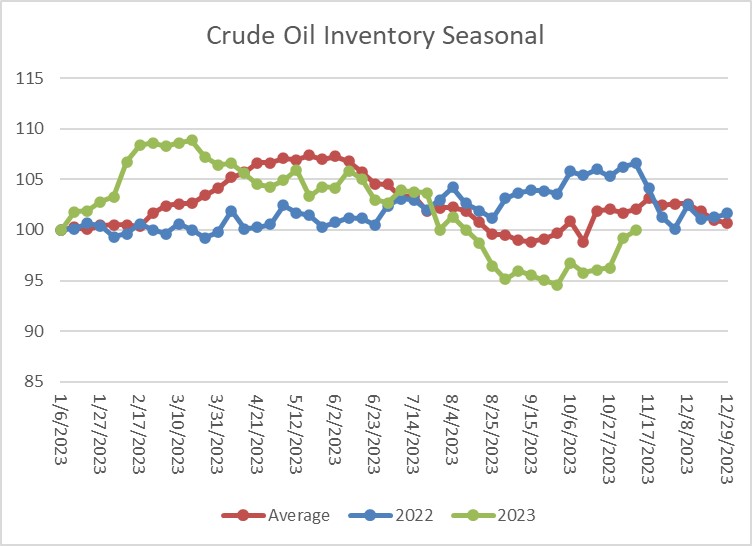
The above chart shows the seasonal pattern for crude oil inventories. We continue to see lower-than-normal inventory accumulation although the gap to average is narrowing.
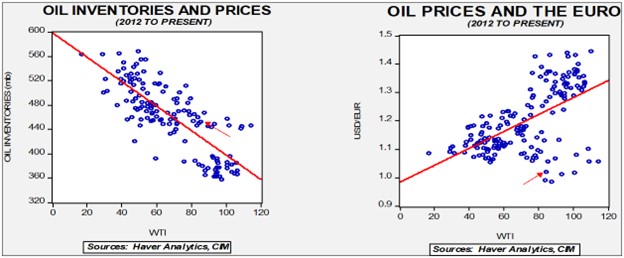
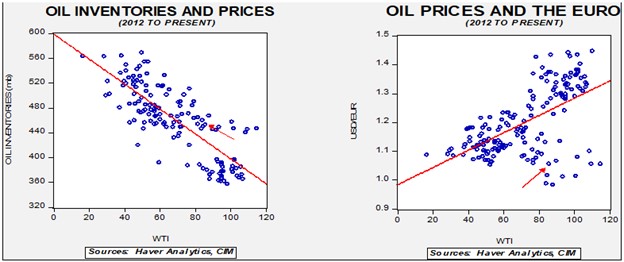
Fair value, using commercial inventories and the EUR for independent variables, yields a price of $67.53. However, given the level of geopolitical risk in the market, we are not surprised that oil prices are well above this model’s fair value.
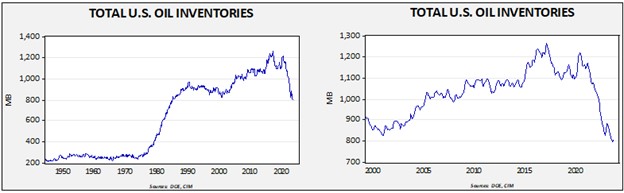
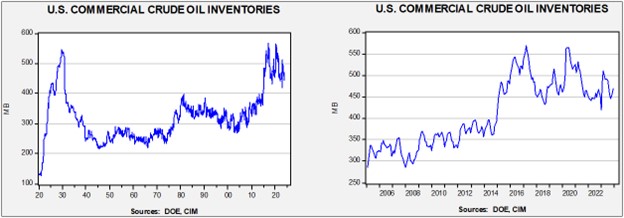
Since the SPR is being used, to some extent, as a buffer stock, we have constructed oil inventory charts incorporating both the SPR and commercial inventories.
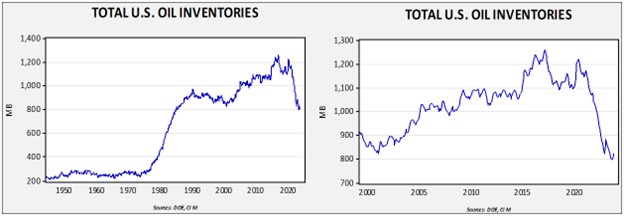
Total stockpiles peaked in 2017 and are now at levels last seen in late 1984. Using total stocks since 2015, fair value is $91.44.
Market News:
- The IEA released its November oil market report, covering the month of October. Rising U.S. and Brazilian oil production lifted global production to 102.0 mbpd. Demand is also expected to be 102.0 mbpd, meaning that inventory accumulation will remain modest. Demand next year is expected to rise to a modest 0.9 mbpd. The IEA estimates that OPEC+ has 5.1 mbpd of spare capacity of which the Kingdom of Saudi Arabia (KSA) has 3.2 mbpd.
- Forecasts from the EIA indicate that the Permian Basin will continue to show production growth, but overall shale production is expected to decline.
- As world leaders prepare for COP28, we see a divergence between promises and behaviors. Despite promises of reduced carbon emissions, nations around the world continue to expand fossil fuel production. This is a classic example of the “free rider” problem, which states that an individual benefits from good but costly behavior, but benefits more from other’s good but costly behavior. And so, no one does anything, but expects others to “do good.” Without an enforcement mechanism, carbon reduction is just talk.
- This year is shaping up to be one of the warmest on record, with October shattering records. The overall upward trend in temperatures is being bolstered by the sunspot cycle, El Niño, and an undersea volcanic eruption earlier this year. If this warmth continues, it will be bearish news for natural gas, propane, and heating oil.
- Environmentalists are targeting the U.S. LNG industry on the grounds of excessive methane emissions. Methane often leaks from natural gas wells and is a potent greenhouse gas. However, if these activists are successful, it puts European energy security at risk.
Geopolitical News:
- Hamas has confirmed that it attacked Israel on fears that its interests were being ignored. The Saudi talks to normalize relations with Israel heightened worries that the Palestinian cause was being forgotten. Despite the attacks, there are reports that the KSA is still interested in continuing talks with Israel.
- Although the markets are acting as if the threat of regionalization has ended, in reality, the risk remains. Iranian proxies have been attacking U.S. bases in the region and the American miliary has responded.
- The Houthis have shot down a U.S. MQ-9 Reaper drone that was said to be over international waters.
- CIA Chief Burns has visited Qatar to try and keep the conflict in Gaza contained.
- Oil executives note that geopolitical risks are intensifying quickly. The acknowledgement of new risks will change the behavior of firms. We could see less interest for projects located in geopolitically risky areas, and a desire to hold more inventory may develop. The recognition of a new risk environment is a significant change.
- ExxonMobil (XOM, $104.85) has agreed to exit the West Qurna 1 oil field project in Iraq with PetroChina (601857, CNY, 7.14) agreeing to be the replacement.
- India has reduced its oil import costs by purchasing Russian crude oil.
- As Russia has almost completely ended piped natural gas exports to Europe, it is trying to sell its excess supply in the LNG market. The U.S. is moving to prevent that from happening by sanctioning buyers of LNG from Russia’s Arctic LNG2 project. North America is rapidly building out LNG capacity.
- Meanwhile, nearly all Russian oil sales are currently above the $60 per barrel cap. Creating a “ghost fleet” of tankers and buyers willing to accept shipments without Western insurance has been the key to avoiding the cap. The U.S. is trying to increase compliance efforts, but these efforts have not tightened supplies so far. Denmark is considering steps that would prevent Russian oil tankers from exiting the Danish straits.
Alternative Energy/Policy News:
- A key element of the energy transition is electrification, which requires copper. We saw the U.S. kill a proposed copper project in Alaska earlier this year, and now Panama has seen protests against another project. Although we understand that local interests need to be considered due to the disruption caused by mining, it is unclear where the copper will come from to meet the demands of the energy transition.
- At the same time, currently weak prices for copper, reflecting a slowing global economy, is dampening enthusiasm for mining investment.
- ExxonMobil plans to open a lithium project in Arkansas in 2027; the company appears to be hedging its oil and gas business.
- China’s dominance in rare earths is well known. Automakers are looking to use less of these metals to reduce China’s influence.
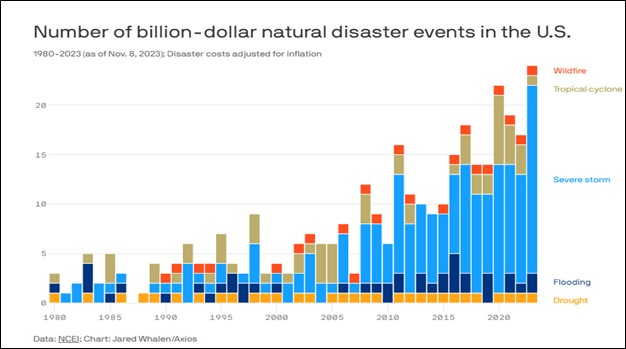
- A new climate report suggests that climate effects are having sizable financial consequences as well. The costs of addressing storms in the U.S. is leading to increases in insurance costs.
- A township board in Michigan has been recalled after it approved tax incentives for a Chinese car battery installation.
- EV sales in the U.S. are slowing, so automakers are increasing discounts to lure buyers. High costs and range anxiety are hurting sales. Research suggests that EVs have fewer miles driven compared to gasoline vehicles, suggesting that EV owners are using the vehicles as “town cars” while still using gasoline cars for distance driving.
- The Utah Associated Municipal Power Systems, an agency representing 50-community owned utilities, canceled a small nuclear modular reactor purchase, citing cost overruns. Small modular nuclear reactors hold the promise of lowering costs because the units are scalable; however, the first one won’t be. The idea still has promise, but what this shows is that it will take a strong financial commitment for this concept to work.
- On the positive side, a new facility will be able to produce high-assay, low-enriched uranium on U.S. soil for the first time. Up until now, the U.S. had been getting this fuel from Russia. The ability to produce this fuel will allow the U.S. to build out advanced nuclear reactors and complete much of the fuel cycle.
- China currently controls about 80% of solar module production capacity. This dominance likely means that nations much either buy from China or pay high prices for domestically produced panels. China appears to be deploying export promotion to support its slow economy, which could lead to gluts in other alternative energy products.
Rapidly rising costs for wind turbines are leading to cancelled projects or attempts to renegotiate prices. If governments don’t get involved, wind projects may stall. Parts companies for windmills indicate that wind goals set for 2030 will not be met.
Note: Due to the Thanksgiving Day holiday, the next report will be issued November 30.