

Tag: stocks
Bi-Weekly Geopolitical Report – I Miss Recessions (September 14, 2026)
by Patrick Fearon-Hernandez, CFA | PDF
One of the most striking aspects of today’s world economy, and the United States economy in particular, is its ability to keep growing despite confidence-shaking events such as the US’s waning geopolitical power, large-scale wars, fracturing trade relations, global supply disruptions, an aging population, the coronavirus pandemic, persistent price inflation, dramatic policy change, and the rise of populist politics. In spite of all these challenges, gross domestic product (GDP) continues to expand, even after stripping out the impact of price changes.
GDP growth isn’t necessarily strong at the moment. In fact, in most key countries, it’s sitting below the long-run average rate. All the same, the continued expansion and lack of recessions would be expected to have big implications for consumers, businesses, and investors. Focusing on the US, this report examines why recessions have become so rare and what the implications might be for financial markets and investment strategy going forward.
Don’t miss our accompanying podcasts, available on our website and most podcast platforms: Apple | Spotify
Asset Allocation Bi-Weekly – The Impact of New Equity Supply (August 31, 2026)
by Bill O’Grady | PDF
In November 1982, the Securities and Exchange Commission (SEC) changed its position on stock buybacks. Prior to this change, the SEC held that buybacks were potentially market manipulation. They weren’t directly banned, but companies buying back their stock ran the risk of being sanctioned for manipulation. In 1982, the SEC decided it needed to clarify its position on buybacks with the introduction of Rule 10b-18, which codified safe harbor requirements for buybacks. Specifically, firms buying back their stock are required to meet the following conditions:
- Use a single broker or dealer per day to bid for or purchase their stock;
- Abide by certain timing restrictions intended to prevent companies from establishing either the opening or closing price of their stock;
- Not offer a price exceeding the highest independent bid or the last independent transaction price on the relevant exchange, whichever is higher; and
- Limit daily repurchases to 25% of the average daily trading volume of their securities during the previous month.
Companies can reward shareholders primarily through dividends or buybacks. The former are simply a cash payment for holding the shares. Unfortunately, they are less tax efficient. Not only do dividend payments stem from after-tax corporate earnings, but the shareholder pays income tax on them as well. Thus, they are “double taxed.” In contrast, buybacks aren’t taxed at all, and by reducing the shares outstanding, all else held equal, one would expect them to push the share price higher.
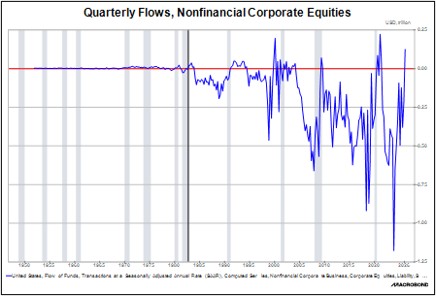
The chart on the next page, from the Federal Reserve’s Financial Accounts of the United States, measures quarterly share flow for the non-financial corporate sector over many decades. In any given quarter, a positive number indicates more shares were issued than extinguished, and vice versa. The chart shows that before the SEC rule change in 1982, only 19% of quarters registered negative flows. After the rule change, this number jumped to 81%.
Due in part to their favorable tax treatment, buybacks became the preferred way to reward shareholders, but another factor had to do with the allocation of power between management and owners. After the Great Depression, there was a bias in corporate governance in favor of labor. Management theorists lamented that management didn’t represent the interests of owners. The change in buyback regulation coincided with the concept of shareholder primacy, which argued that publicly traded firms should focus on shareholder returns over other interests. Senior managers and, over time, other workers were partly paid in shares, aligning management with owners. Persistent buybacks became an element of shareholder primacy.
In the next chart, we’ve aggregated the flows data (blue) to show the accumulated buybacks over time. We’ve also overlayed that data with the S&P 500 price index (pink).
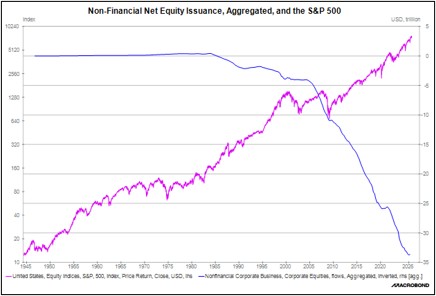
The trends in both series are rather obvious, but after the Great Financial Crisis, buybacks played an increasing role in supporting stock prices. It’s worth noting that in periods where cumulative buybacks slowed, the market stalled. That’s important now because the funding needs for artificial intelligence investment are leading to increased equity issuance, as the first chart shows. This new stock issuance will almost certainly increase in the coming quarters. For instance, the recent initial public offering (IPO) for SpaceX isn’t recorded in this data yet. The expected IPOs of Anthropic and OpenAI will likely lift issuance even further.
This analysis doesn’t necessarily mean a bear market is looming. However, it does indicate that equity markets could face headwinds in the coming quarters as more firms issue stock to fund their AI investment needs. We therefore think that diversifying into neglected areas of the equity markets, such as value and international, would offer some degree of protection from projected overall market weakness.
Note: There will be no accompanying podcast for this report.
Bi-Weekly Geopolitical Podcast – #77 “Meet Sanae Takaichi” (Posted 11/17/25)
Bi-Weekly Geopolitical Report – Meet Sanae Takaichi (November 10, 2025)
by Patrick Fearon-Hernandez, CFA | PDF
In October 2025, Japan made history by electing its first female prime minister, Sanae Takaichi, a staunch conservative and protégé of former Prime Minister Shinzo Abe. Her rise to power marks a significant shift in Japan’s political landscape, with implications for foreign affairs, domestic policy, and financial markets. As we show in this report, Takaichi’s administration promises a blend of hawkish national security, aggressive fiscal expansion, and economic revitalization, all underpinned by a nationalist ideology. As always, we wrap up the report with a discussion of the investment implications of her rise to power.
Note: The accompanying podcast for this report will be delayed until later this week.
Asset Allocation Bi-Weekly – The Cap-Weighted and Equal-Weighted S&P 500 (September 8, 2025)
by Patrick Fearon-Hernandez, CFA | PDF
There are many ways to describe the strong performance in large cap US stock prices this year. You could simply call it a bull market, with the S&P 500 total return index up 31.2% since its low in early April and up 11.5% year-to-date. The strong buying pressure could even be called a “euphoria.” With continued gains, it would be no surprise if some observers started referring to it as a return to the type of “irrational exuberance” seen in the 1990s. In any case, the market is exhibiting strong momentum, especially in the growthy sectors such as Information Technology and Communication Services. Indeed, investors now widely understand that the lion’s share of the uptrend this year has come from just a few stocks within those sectors, i.e., the Magnificent 7. A key question is whether these trends will continue. And to the extent that there is a risk of these trends reversing, is there a good way to hedge the associated downside risk?
The growth of index investing in recent decades is probably one reason for the outperformance of large cap growth stocks like the Mag 7. Many individual and institutional investors simply channel their US large cap stock investments into funds tracking the S&P 500 Index, where each holding is weighted by the stock’s total market capitalization. Funds channeled into this version of the S&P 500 go disproportionately to those stocks with big market caps, especially the Mag 7, helping them appreciate even more. But there is also a version of the S&P 500 in which the allocation to each stock is an equal 0.2% — the S&P 500 Equal Weight Index. In this methodology, stocks with smaller capitalizations and more “value” characteristics have a higher representation than they do in the capitalization-weighted version. If we compare the performance of the cap-weighted S&P 500 to that of its equal-weighted counterpart, we can get a sense of the relative advantages or disadvantages of each index during different market scenarios.
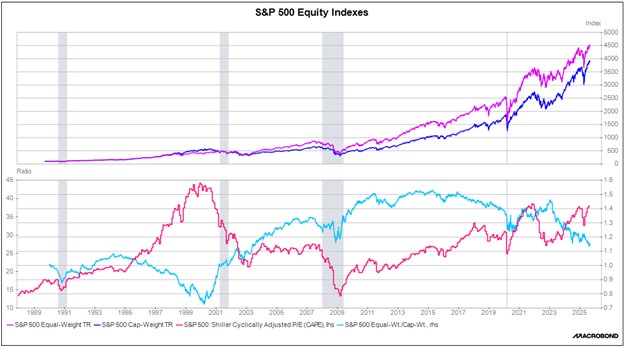
In the upper panel of the following chart, we show the S&P 500’s total return index in both its cap-weighted and equal-weighted forms, with each based to 100 in January 1990. The figure shows that over the last 35 years, the equal-weighted variation of the S&P 500 has produced a meaningfully higher total return than the market cap-weighted one. (Consistent with finance theory, the higher return for the equal-weighted index also comes with a higher standard deviation.)
Importantly, the relative performance of the two indexes changes over time. In the bottom panel of the chart, the light blue line shows the relative performance of the equal-weighted index to that of the version weighted by market cap. We have also included the Case-Shiller cyclically adjusted price/earnings ratio as a measure of average stock valuation.
In the bottom panel, the long downtrends in the blue line from 1995 to 2000 and from 2015 to the present coincide with periods of intense market enthusiasm, strong momentum in big, popular growth stocks, and lagging performance in relatively smaller, less growthy stocks. These periods generally happen when investors are pouring funds into the market and driving up valuations. In these periods, including the present, it can be tempting for investors to just focus on the large cap growth stocks driving the market. However, the chart clearly shows that when market enthusiasm eventually reverses and investors pull out of the market, the relative advantage of the equal-weight index snaps back sharply. This reflects the sudden sell-off in trending, growthy, highly weighted stocks during such periods. In sum, the bottom panel illustrates how concentration risk increases in long, strong bull markets. This tends to set the stage for sharp portfolio declines when markets go into reverse, even for investors who think they are well diversified because they are invested in the cap-weighted S&P 500.
The lesson from this discussion is that while fast-rising large cap growth stocks like the Mag 7 may still have some momentum left, investors should also consider broad diversification with meaningful exposure to undervalued and overlooked stocks, which could have the potential for solid, longer-run returns.
Don’t miss our accompanying podcasts, available on our website and most podcast platforms: Apple | Spotify
Asset Allocation Bi-Weekly – #147 “The Cap-Weighted and Equal-Weighted S&P 500” (Posted 9/8/25)
Asset Allocation Bi-Weekly – #145 “No Country for Recessions” (Posted 8/8/25)
Asset Allocation Bi-Weekly – No Country for Recessions (August 4, 2025)
by Bill O’Grady | PDF
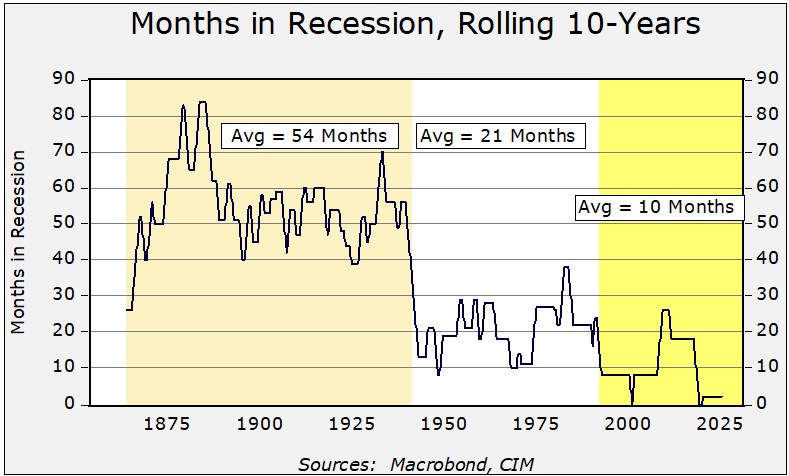
Recessions in the United States have become less frequent over time. To illustrate this, the chart below shows data from the National Bureau of Economic Research, the official arbiter of recessions in the US, which has been establishing business cycles since January 1854. In the chart, we show the total months spent in recession over a rolling 10-year period. Clearly, we have seen the incidence of recession decline over time. From 1864 until 1940, recessions occurred, on average, 54 months out of 120 months, or 45% of the time. From 1941 to 1991, the average declined to 21 months, or 18% of the time. Since 1991, the average fell to 10 months, or 8% of the time.
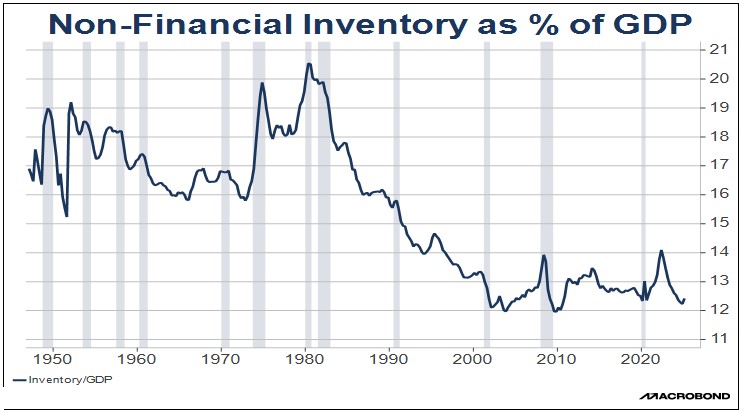
Why has the incidence of recessions declined? There are three primary reasons. First, as the economy evolved into being dominated by services instead of manufacturing, there were less inventory misallocations causing slumps, especially after 1980. As shown in the next chart, inventories relative to gross domestic product (GDP) have clearly fallen. Therefore, the likelihood of excess inventories or other issues arising from misallocation of inventory also fell.
Second, until the 1930s, recessions were thought to be natural occurrences. Often, the burden of policies that allowed recessions tended to fall on debtors and the lower classes, who had limited political influence. After WWI, this idea became contested and was one of the reasons for the unraveling of the gold standard. Because the gold standard created inelastic conditions for liquidity, central banks were restricted from easing credit conditions during downturns, leading to deflation. After WWII, monetary and fiscal policy became countercyclical; in other words, policies were designed to either prevent or mitigate recessions. By the mid-1990s, monetary policy transparency became the norm, further reducing the amount of policy shocks.
The third factor behind less-frequent recessions is the expansion of globalization that started in 1978 with deregulation and accelerated after the end of the Cold War. The rise of globalization increased the available supply, which led to lower inflation and a decline in interest rates. This period, dubbed “the great moderation,” made it easier to extend the business cycle.
This history raises two questions. First, will this period of infrequent recessions continue? And second, what are the ramifications if it does? Addressing them in order, it’s likely that infrequent recessions will continue because two of the three conditions described above should remain in place. We expect that services will continue to dominate the economy, while modern inventory management will maintain stability. At the same time, countercyclical policy isn’t likely to change. If anything, policy accommodation appears to be expanding (raising inflation concerns). In our view, only the third condition for less-frequent recessions will be less supportive. As the US attempts to rebalance the global trading environment, imports will become less plentiful, and the potential for supply shocks will rise. Of course, as domestic production responds, the potential for foreign-driven supply shocks (as observed during the pandemic) will also be less of an issue. But overall, the trend toward fewer downturns looks to be in place.
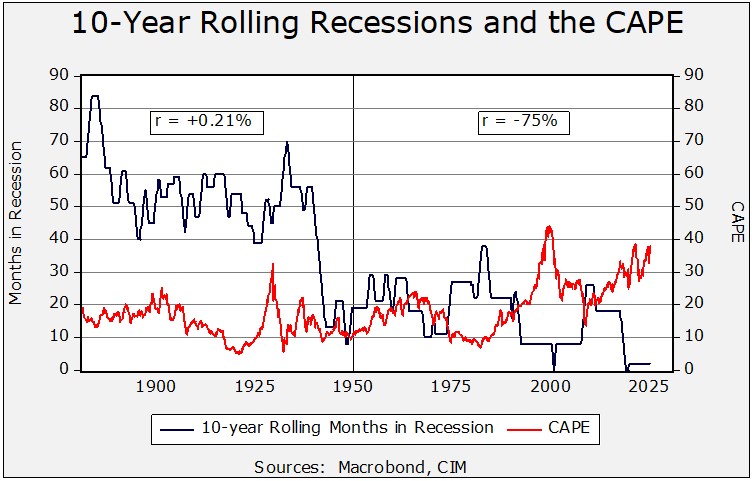
What does this mean for equity markets? Less frequent recessions, at least in the postwar period, correlate with higher price/earnings multiples. We show this in the chart below, which overlays the rolling decades of recessions with the Shiller cyclically adjusted P/E ratio. From 1870 to 1950, the correlation was low and positive. However, since 1950, the correlation has increased significantly and turned negative. In other words, the declining occurrence of recessions is now associated with higher stock valuations.
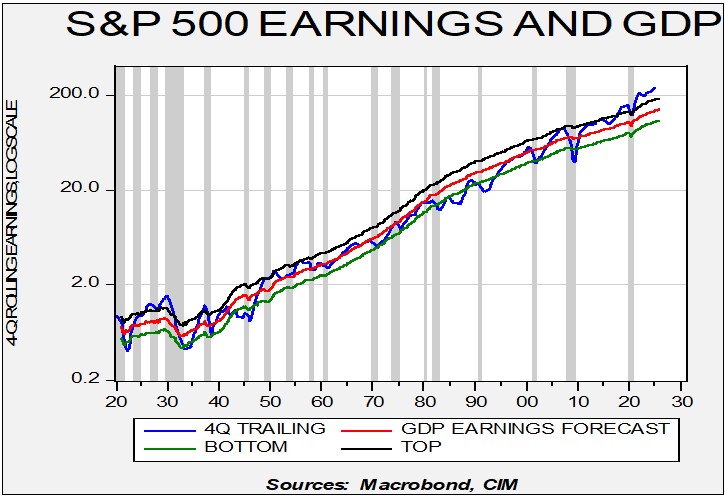
Finally, the chart below shows S&P 500 earnings on a four-quarter rolling basis compared to a regression of earnings to nominal GDP. Recessions are indicated by the vertical grey bands. The chart shows that, in the postwar era, recessions tend to depress earnings. Thus, if recessions remain less frequent, it makes sense that the earnings multiple would be higher. Investors generally can worry less about economic downturns, giving them greater confidence to bid up stock values relative to earnings.