

Tag: Iran
Asset Allocation Bi-Weekly – #164 “China Cuts Its Energy Imports” (Posted 6/15/26)
Asset Allocation Bi-Weekly – China Cuts Its Energy Imports (June 15, 2026)
by Patrick Fearon-Hernandez, CFA | PDF
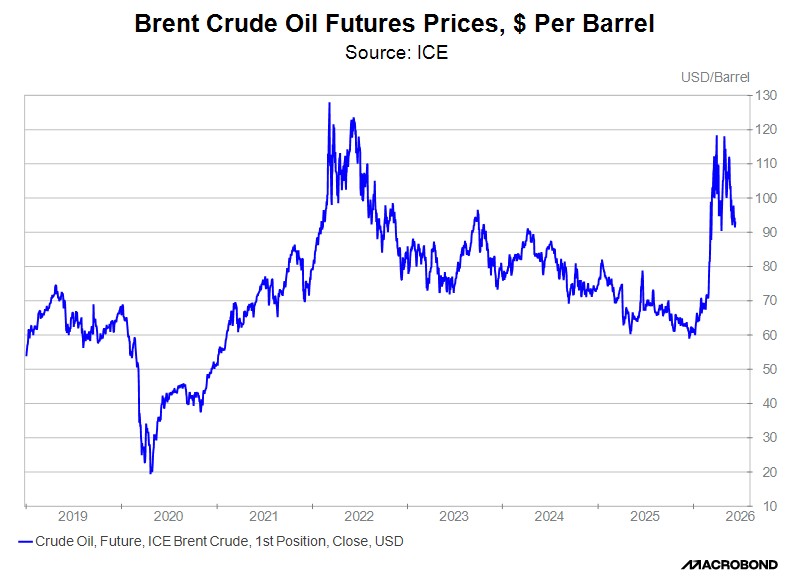
As we’ve noted before, the most immediate economic and financial market risk from the Iran war is the possibility of further price hikes for oil, natural gas, and some other commodities that depend heavily on shipping through the Strait of Hormuz. Because of the war, the strait has now been essentially shut down for more than three months. Global energy and other commodity prices have indeed increased. As shown in the chart below, near Brent crude oil futures prices jumped approximately 50% in the weeks after the war started on February 28. However, the escalation in prices has been relatively contained and prices have even started to fall back recently. That’s despite assurances from economists and energy analysts that prolonged closure of the strait would inevitably lead to further price hikes. In this report, we show that a massive pullback in Chinese energy imports has probably been a key reason why prices haven’t risen as much as feared, at least so far. We also show that the pullback in Chinese energy demand has helped set the stage for recent stock market dynamics.
The unexpected pullback in energy prices was a mystery in recent weeks, especially since official data and anecdotes suggested that the closure of the strait was forcing countries around the world to use up their inventories. For example, the International Energy Agency warned in its May market review: “The world is drawing oil inventories at a record pace as importing countries confront unprecedented disruptions to Middle Eastern supplies.” According to the IEA, global oil stocks had plummeted by almost 250 million barrels since the start of the war, with even steeper declines if stranded stockpiles in the Middle East are excluded. Such inventory depletion would normally be expected to boost prices.
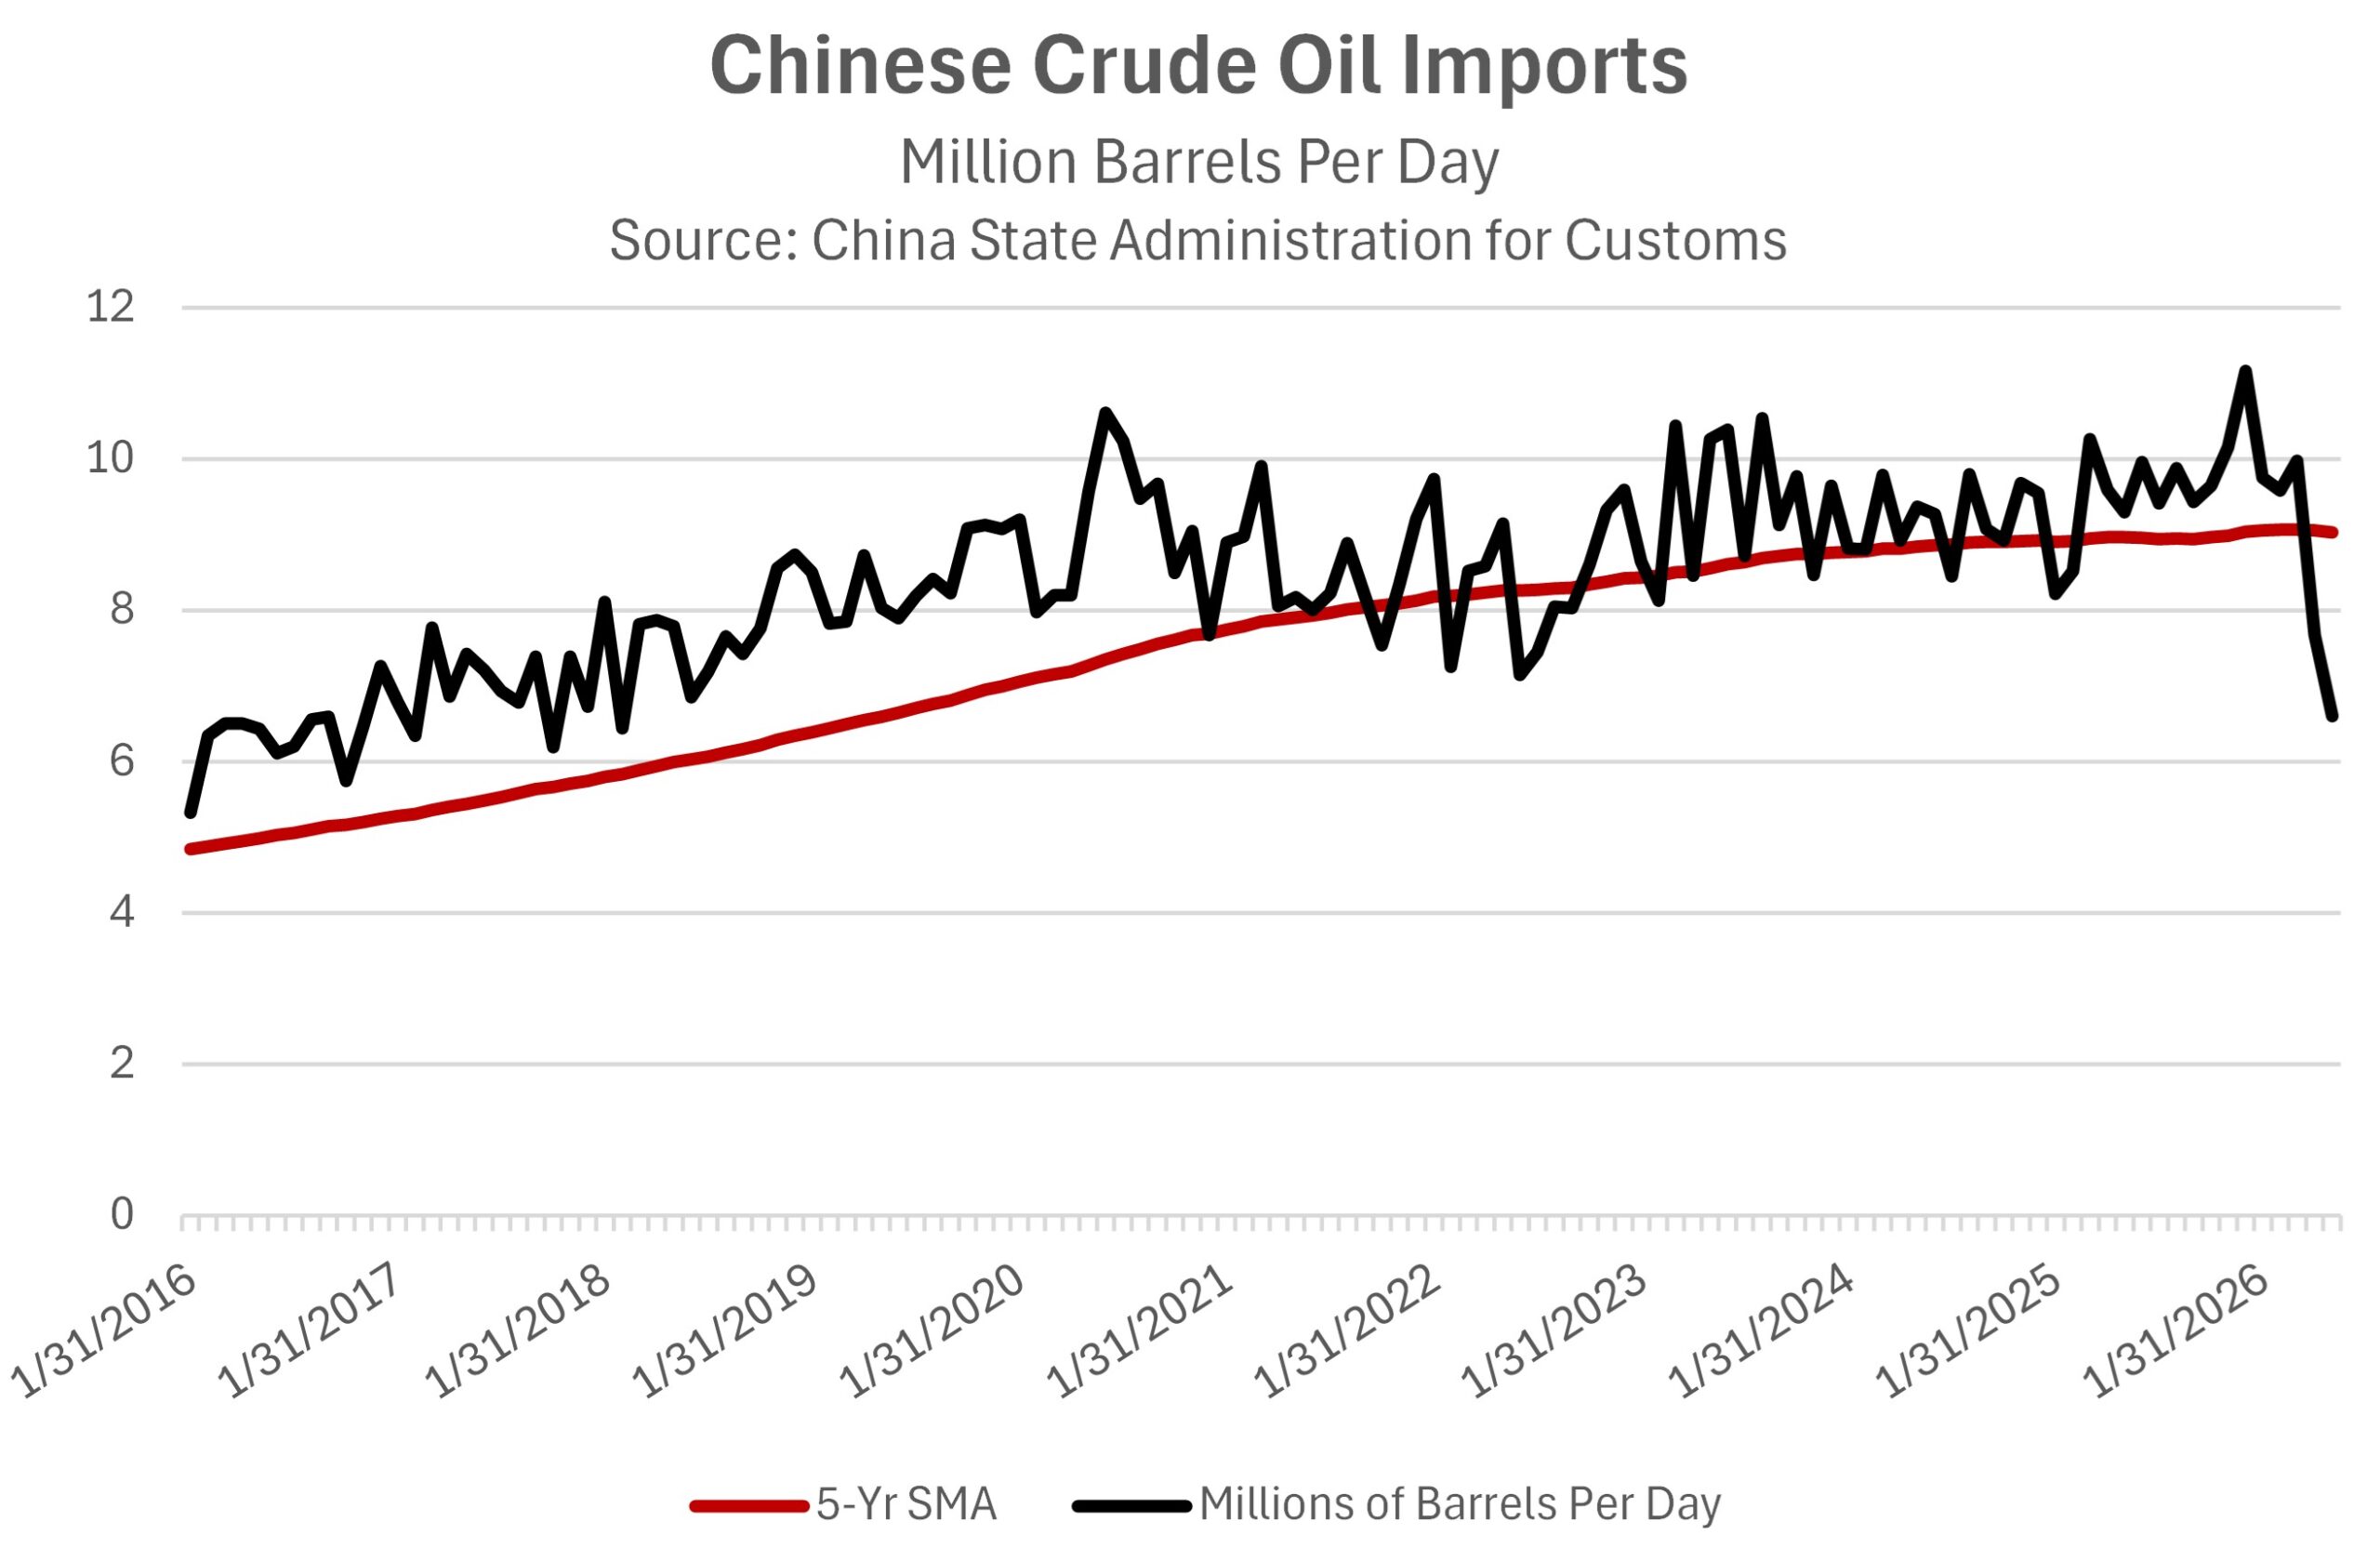
More recent data appears to solve the mystery about why energy prices haven’t risen further and have even fallen back. Recent data shows Chinese oil imports have dropped to approximately 6.6 million barrels per day, down 38% from the average of about 10.6 mbpd in 2025. The drop of about 4.0 mbpd equates to almost 4% of current global oil demand. It could also offset much of the net reduction in global oil shipments through the strait, which analysts estimate to be between 6.0 and 12.0 mbpd.
Chinese energy imports and inventories are notoriously opaque, so these figures are uncertain. Nevertheless, if China really has cut its energy imports as indicated, it would go far toward explaining why energy prices have started to pull back, at least for now. We still believe that a long delay in opening the strait would keep alive the risk of further energy inventory depletion and renewed price spikes. However, China’s apparent disdain for paying elevated prices and its willingness to cut back deliveries is having a salutary impact on global prices and helping calm the world’s financial markets for now.
Going forward, if this trend continues, it will have big implications. For example, China’s ability to forego expensive energy imports helps validate its “all of the above” energy policy, in which it has invested in the full span of possible energy sources, ranging from coal, oil, and natural gas to nuclear, wind, and solar. China is now benefiting from the flexibility it has gained from having such a broad array of energy sources. We also think this situation illustrates how much economic flexibility China has gained from building its enormous strategic reserves of energy and other commodities. Although China won’t reveal the true level of its inventories, outside analysts estimate that they are currently several times bigger than the US’s Strategic Petroleum Reserve. It would be no surprise if governments around the world now take a lesson from China’s approach and try to adopt a similar all-of-the-above energy policy and start rebuilding inventories once the war is over and prices come back down.
For the financial markets, the decline in oil prices wrought by China’s import cuts has probably been a key reason for the recent modest retreat in inflation concerns and in government bond yields. For example, the yield on 10-year Treasury notes fell from about 4.65% in mid-May to about 4.45% at the start of June. We suspect this has encouraged investors to return to the frenzied buying of US large cap technology stocks related to artificial intelligence. It has also arrested investors’ early 2026 rotation toward value stocks. As we noted above, however, the continued war in Iran is likely still depleting energy inventories around the world, including in China. That likely translates into a continued risk of further energy price spikes and rising bond yields in the coming months if the war isn’t resolved.
Don’t miss our accompanying podcasts, available on our website and most podcast platforms: Apple | Spotify
Confluence Mailbag – #10 “The End of Hegemony, the Iran Stalemate, and the AI Bubble” (Posted 5/26/26)
Asset Allocation Bi-Weekly – The Power of Gold (May 11, 2026)
by Patrick Fearon-Hernandez, CFA | PDF
Since the Iran war began on February 28, several corners of the financial market have behaved in unusual and unexpected ways, with gold prices being perhaps the most surprising. Gold has been a safe-haven asset for centuries, and investors have come to expect its value to rise in times of crisis or conflict. Indeed, many investors hold gold specifically to hedge against political instability or other disasters, just as they tend to hold it to hedge against currency debasement or price inflation. In this case, however, gold prices fell sharply in the days after the war commenced and have only modestly rebounded in recent weeks. What’s behind this extraordinary behavior?
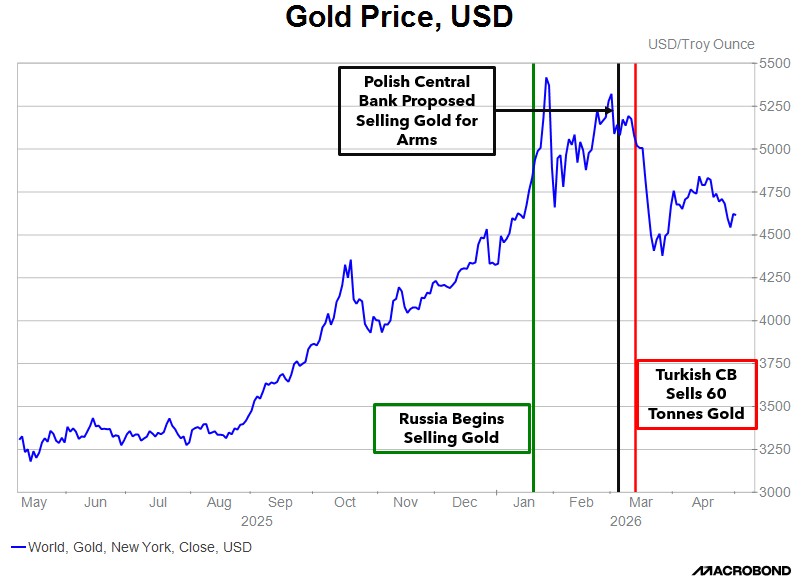
In our view, gold prices fell mostly because central banks and other major investors have been trying to raise liquidity ahead of an anticipated spike in costs. For example, since most oil is traded in dollars, central banks in oil-importing countries must raise greenbacks to prepare for a surge in oil import costs. The chart of gold prices above illustrates the phenomenon. In the chart, the vertical red line shows when Turkey’s central bank announced it would sell 60 tonnes of gold to raise dollars. Other central banks also reportedly started selling gold at about the same time, taking profits after gold prices skyrocketed in the months ahead of the war. This also marks the date when gold prices began to soften in response to all this selling. Gold prices dropped from about $5,200 per ounce in early March to about $4,700 per ounce at the end of April, for a decline of almost 10%. In contrast, other traditional safe-haven assets have held their value much better. Medium-term Treasury notes had a negative total return of 1.5%, while three-month bills returned about 0.6%.
One new factor is that many foreign reserve managers now see gold as a replacement for US Treasurys. It therefore makes sense, in a crisis, for them to sell the yellow metal to raise liquidity. Before the US levied sanctions on Iran and Russia in recent years, reserve managers tended to view Treasurys and gold as complementary: Gold was held as a long-term asset, while Treasurys were prized for liquidity management. Thus, gold sales were rare, and when they were executed, it was usually due to a structural decision as to the allocation of gold and Treasurys. Following the US imposition of sanctions on foreign-held Treasurys, gold is now being seen as a substitute. One change this appears to be causing is that reserve managers will now sell gold to raise liquidity. Due to this change in reserve management practice, we think gold prices are likely to become more volatile going forward.
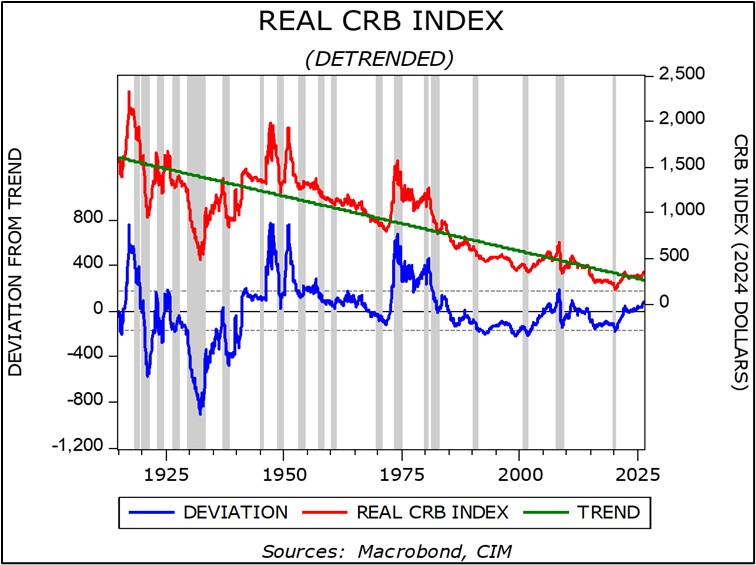
An important question is whether gold will rebound and regain its reputation as a safe-haven asset. On that score, we’re optimistic given the historical behavior of commodity prices generally, and gold prices in particular, during periods of conflict and geopolitical upheaval. In the chart above, the red line shows how the inflation-adjusted CRB commodity-price index has changed over time. The green, downward-sloping trend line shows that real commodity prices tend to fall over time. This is what would be expected in a capitalist economy that incentivizes commodity producers to boost output and users to use less. However, in periods of geopolitical conflict or major supply disruptions, such as the periods around World War II and in the mid-1970s, commodity prices may spike well above the trend and stay high for some time. We think we’re heading into an era like that now. In fact, we can see that the red index line is now moving above the trendline.
For centuries, gold has been prized as a safe, secure store of value based on characteristics such as its density, malleability, and resistance to corrosion. We therefore believe that its recent liquidity-driven selling is likely to peter out soon, if it hasn’t already done so, even if gold prices remain more volatile than in the past. We also think global central banks could replenish their gold holdings once the war in Iran cools down. After all, we think many central banks want to continue diversifying their reserves away from the US dollar and the risk that dollar holdings pose for US sanctions. The recent modest rebound in gold prices gives us some confidence in that stance. In fact, we have recently increased our exposure to gold in some of the Confluence Asset Allocation strategies, while keeping our allocations to the yellow metal unchanged in the others.
Don’t miss our accompanying podcasts, available on our website and most podcast platforms: Apple | Spotify
Confluence Mailbag – #9 “Dollar Dominance, Private Credit, and the Great Rotation” (Posted 4/24/26)
Bi-Weekly Geopolitical Podcast – #85 “The War in Iran and the End of US Hegemony” (Posted 4/20/26)
Bi-Weekly Geopolitical Report – The War in Iran and the End of US Hegemony (April 20, 2026)
by Patrick Fearon-Hernandez, CFA | PDF
In a Bi-Weekly Geopolitical Report late last year, we argued that the 2025 trade dispute between the United States and China revealed just how dramatically Beijing has increased its comprehensive power — military, political, economic, and technological. We argued that China’s comprehensive power may now rival or even surpass that of the US, potentially ending the US’s traditional role as the global hegemon, i.e., the big, strong, dominant country that provides the world with security, order, and the reserve currency. Now that the US has launched a war against Iran — a key member of China’s geopolitical and economic bloc — the world has seen additional evidence that the US may not continue as a hegemonic power. In this report, we examine the evidence pointing to the US relinquishing its hegemonic role and what that means for investors.