

Tag: gold
Asset Allocation Bi-Weekly – The Power of Gold (May 11, 2026)
by Patrick Fearon-Hernandez, CFA | PDF
Since the Iran war began on February 28, several corners of the financial market have behaved in unusual and unexpected ways, with gold prices being perhaps the most surprising. Gold has been a safe-haven asset for centuries, and investors have come to expect its value to rise in times of crisis or conflict. Indeed, many investors hold gold specifically to hedge against political instability or other disasters, just as they tend to hold it to hedge against currency debasement or price inflation. In this case, however, gold prices fell sharply in the days after the war commenced and have only modestly rebounded in recent weeks. What’s behind this extraordinary behavior?
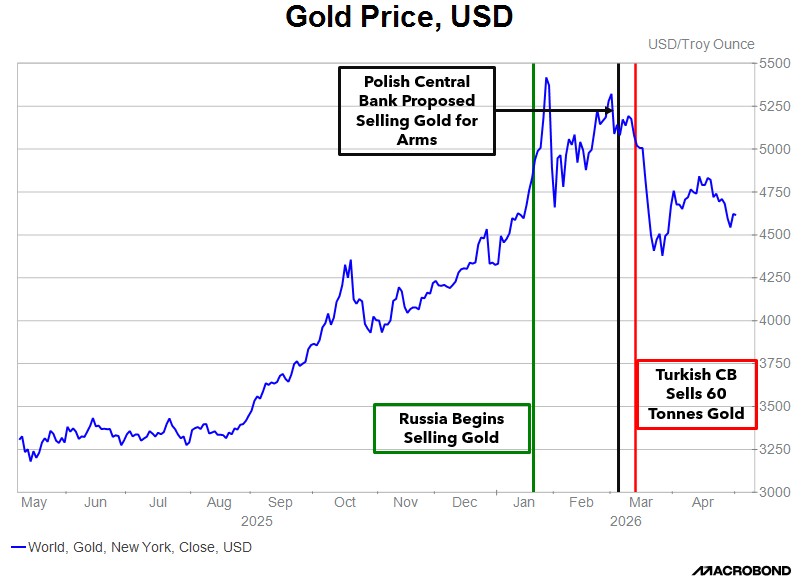
In our view, gold prices fell mostly because central banks and other major investors have been trying to raise liquidity ahead of an anticipated spike in costs. For example, since most oil is traded in dollars, central banks in oil-importing countries must raise greenbacks to prepare for a surge in oil import costs. The chart of gold prices above illustrates the phenomenon. In the chart, the vertical red line shows when Turkey’s central bank announced it would sell 60 tonnes of gold to raise dollars. Other central banks also reportedly started selling gold at about the same time, taking profits after gold prices skyrocketed in the months ahead of the war. This also marks the date when gold prices began to soften in response to all this selling. Gold prices dropped from about $5,200 per ounce in early March to about $4,700 per ounce at the end of April, for a decline of almost 10%. In contrast, other traditional safe-haven assets have held their value much better. Medium-term Treasury notes had a negative total return of 1.5%, while three-month bills returned about 0.6%.
One new factor is that many foreign reserve managers now see gold as a replacement for US Treasurys. It therefore makes sense, in a crisis, for them to sell the yellow metal to raise liquidity. Before the US levied sanctions on Iran and Russia in recent years, reserve managers tended to view Treasurys and gold as complementary: Gold was held as a long-term asset, while Treasurys were prized for liquidity management. Thus, gold sales were rare, and when they were executed, it was usually due to a structural decision as to the allocation of gold and Treasurys. Following the US imposition of sanctions on foreign-held Treasurys, gold is now being seen as a substitute. One change this appears to be causing is that reserve managers will now sell gold to raise liquidity. Due to this change in reserve management practice, we think gold prices are likely to become more volatile going forward.
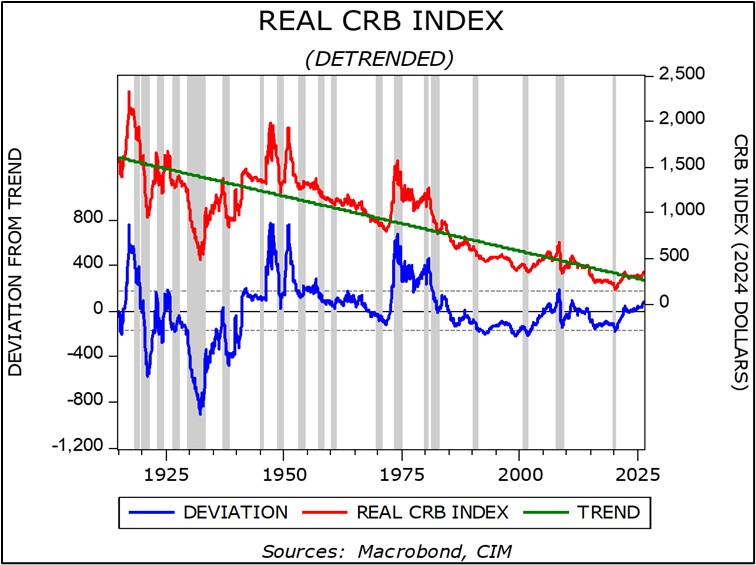
An important question is whether gold will rebound and regain its reputation as a safe-haven asset. On that score, we’re optimistic given the historical behavior of commodity prices generally, and gold prices in particular, during periods of conflict and geopolitical upheaval. In the chart above, the red line shows how the inflation-adjusted CRB commodity-price index has changed over time. The green, downward-sloping trend line shows that real commodity prices tend to fall over time. This is what would be expected in a capitalist economy that incentivizes commodity producers to boost output and users to use less. However, in periods of geopolitical conflict or major supply disruptions, such as the periods around World War II and in the mid-1970s, commodity prices may spike well above the trend and stay high for some time. We think we’re heading into an era like that now. In fact, we can see that the red index line is now moving above the trendline.
For centuries, gold has been prized as a safe, secure store of value based on characteristics such as its density, malleability, and resistance to corrosion. We therefore believe that its recent liquidity-driven selling is likely to peter out soon, if it hasn’t already done so, even if gold prices remain more volatile than in the past. We also think global central banks could replenish their gold holdings once the war in Iran cools down. After all, we think many central banks want to continue diversifying their reserves away from the US dollar and the risk that dollar holdings pose for US sanctions. The recent modest rebound in gold prices gives us some confidence in that stance. In fact, we have recently increased our exposure to gold in some of the Confluence Asset Allocation strategies, while keeping our allocations to the yellow metal unchanged in the others.
Don’t miss our accompanying podcasts, available on our website and most podcast platforms: Apple | Spotify
Confluence Mailbag – #6 “Money, Market Risks, and Investing in a Multipolar World ” (Posted 12/29/25)
Confluence Mailbag – #5 “Escalation Dominance and the Costs of a Recession-Free World” (Posted 11/5/25)
Asset Allocation Bi-Weekly – The Debasement Hedge: A Tale of Two Safeties (October 20, 2025)
by Thomas Wash | PDF
The surge of gold past the $4,000-per-ounce level in October marks a definitive pivot in market behavior. Unlike past rallies driven by stock market fear, the current move is distinctly characterized by a structural rotation away from sovereign debt and toward tangible assets. This is not a simple risk-off move. Instead, investors are executing a sophisticated dual strategy of maintaining a critical allocation to equity momentum while actively using gold as the premier defense against systemic threats, specifically fiat currency debasement and sovereign debt risk.
This strategic pivot is rooted in three primary policy-driven anxieties: massive sovereign debt issuance, persistent inflationary pressures, and the weaponization of the US dollar. The extraordinary fiscal stimulus unleashed during the pandemic, while cushioning the immediate economic shock, led to an unprecedented accumulation of public debt and entrenched higher inflation. Together, these developments have eroded confidence in fiscal governance, as is evidenced by rising government borrowing costs and mounting concerns over long-term debt sustainability.
Confidence deteriorated further after Russia’s invasion of Ukraine. The coordinated Western move to weaponize the dollar as a financial sanction tool undermined its perceived neutrality as the global reserve asset. The episode crystallized a new risk that access to the dollar system could be constrained by geopolitics. In response, many central banks — particularly in emerging markets — have accelerated gold accumulation as a reserve diversification strategy, signaling a gradual but consequential retreat from pure fiat dependency.
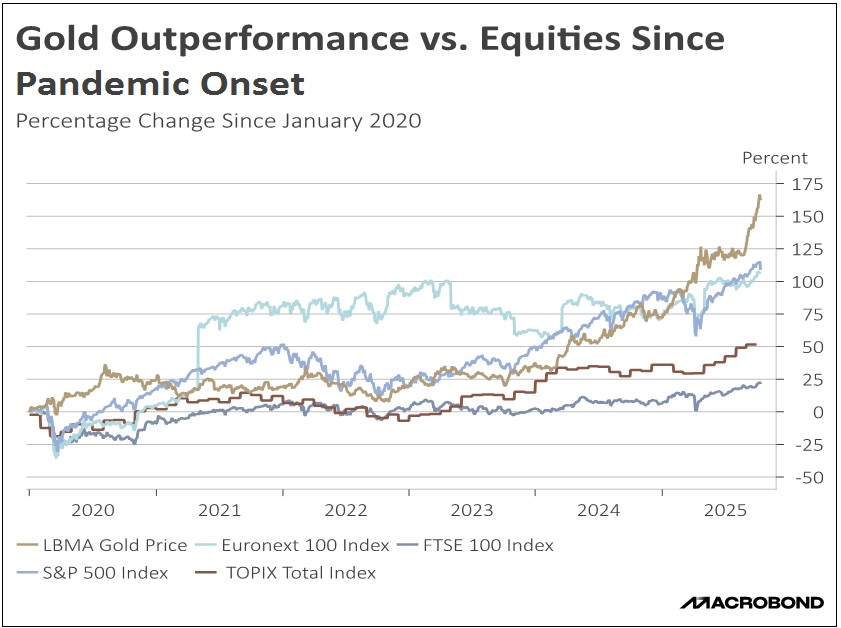
Yet the flight to safety has not been uniform. Equities, especially high-quality large cap stocks, have also benefited from safe-haven inflows. Investors are directing capital into US technology giants for their robust earnings power and balance sheets, and into European pharmaceutical and defense firms for their resilience and defensive characteristics. This reflects a redefinition of safety as select equities are viewed not merely as growth vehicles but as durable stores of value capable of navigating structural volatility.
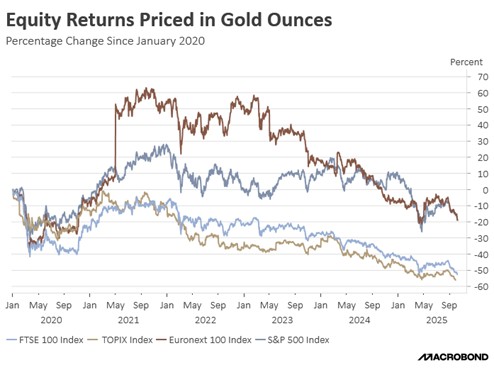
The relative performance of equities versus gold reveals this nuanced dynamic. When measured in gold terms, European equities briefly outperformed in 2021, a trend reversed by the war in Ukraine. US equities have since maintained steadier ground buoyed by comparatively stronger growth, though their relative strength has softened amid tariff-related tensions. Since 2020, US and European equities have traded largely in line in gold terms, suggesting that gold’s continued dominance will hinge on currency dynamics. A bullish dollar would likely favor US equities, while a bearish dollar could tilt the advantage toward Europe.
Gold’s historic rally thus signals more than inflation hedging — it also represents a crisis of confidence in the traditional financial order. Yet, the simultaneous preference for resilient equities underscores an important nuance: investors are not abandoning growth but recalibrating their definition of safety. Gold and select large cap stocks now operate as complementary safe havens, with the former guarding against systemic and currency risks, while the latter preserves value through corporate strength and adaptability.
Ultimately, the long-term interplay between these two pillars will serve as a barometer of market confidence. Gold will remain the preferred store of value as long as fiscal fragility and geopolitical instability persist. Conversely, a sustained stabilization of the US dollar coupled with credible fiscal consolidation could reignite a stronger rotation toward equities. Until that shift materializes, gold’s record valuation reflects a market structurally repositioned for a more volatile and less predictable financial era.
Don’t miss our accompanying podcasts, available on our website and most podcast platforms: Apple | Spotify
Asset Allocation Bi-Weekly – #150 “The Debasement Hedge: A Tale of Two Safeties” (Posted 10/20/25)
Asset Allocation Bi-Weekly – #139 “US Capital Flight and the Implications for Investors” (Posted 5/5/25)
Asset Allocation Bi-Weekly – US Capital Flight and the Implications for Investors (May 5, 2025)
by Patrick Fearon-Hernandez, CFA | PDF
Oh, what a difference one calendar quarter can make! Shortly after Donald Trump was sworn in to his second term as president of the United States, we wrote that the US seemed to enjoy exceptional advantages versus the rest of the world in terms of its economic growth, political stability, and stock market returns. Other economists and market commentators echoed those views. However, just three months into Trump’s new term, many investors seem to be losing confidence in the US’s economic growth and management. As we discuss in this report, the evidence pointing in that direction includes a rise in the yields on US Treasury obligations, a depreciating dollar, and surging gold prices. Below, we discuss these trends and what they may mean for world financial markets going forward.
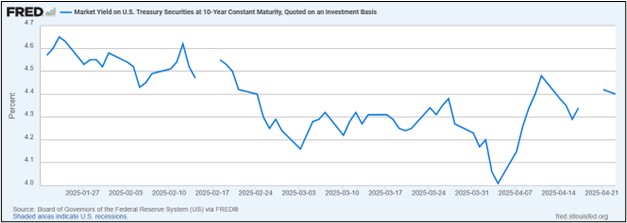
Reduced Bond Buying / Rising Bond Yields. As shown in the chart on the next page, the yield on the benchmark 10-year Treasury note stood at 4.57% on the first business day after Trump’s inauguration in January. Investors continued to scoop up Treasurys in the weeks following the ceremony, driven by expectations of slower economic growth, easing inflation pressures, and further interest rate cuts by the Federal Reserve. As the administration revealed more about its tariff plans and other aspects of economic policy, growing concerns about the US economy pushed 10-year Treasury yields as low as 4.01% in early April. Since then, however, Treasurys have sold off sharply. Importantly, it appears that foreign institutions in Japan and elsewhere have been a big part of the sell-off. In any case, 10-year Treasury yields have spiked to more than 4.40% since mid-April. The yield on 30-year Treasurys has spiked to as high as 4.91%.
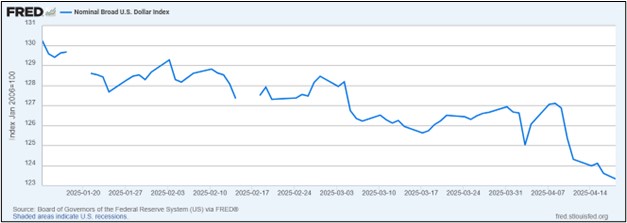
A Depreciating Dollar. Just as US Treasurys have sold off, the dollar has depreciated against many key currencies. The chart below shows the Fed’s nominal US Dollar Index, which tracks the value of the greenback against a broad range of foreign currencies. The broad index shows the dollar has lost about 4.10% of its value since Inauguration Day, with an especially sharp drop since Trump announced the pause in his “reciprocal” tariffs on April 9. The dollar has especially fallen sharply against developed country currencies, such as the euro.
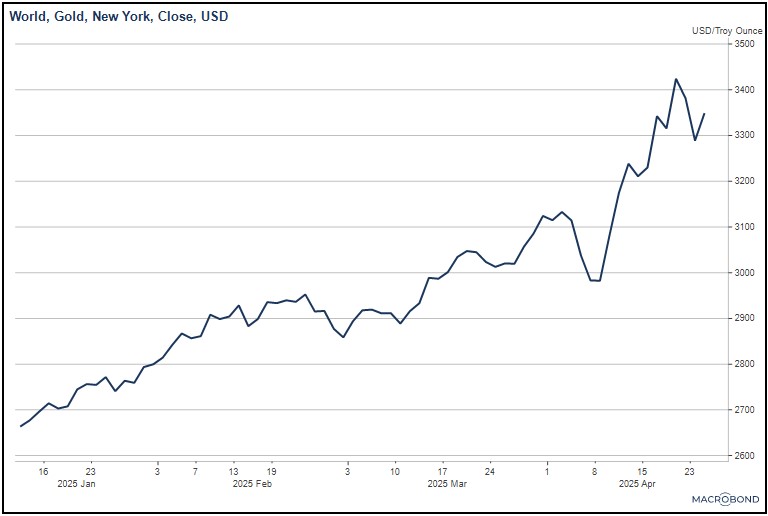
Rising Gold Prices. Rising bond yields and a falling dollar point to falling confidence in the US among global investors, so it should be no surprise that gold — the quintessential safe haven — has appreciated sharply. As shown in the next chart, gold prices have even reached a record high above $3,400 per ounce, with much of the increase coming since early April.
Of course, many long-term investors have been more focused on the recent volatility in US risk assets, especially stocks. In our view, the unique combination of market forces described above may be the more important underlying story. The rise in US bond yields, the decline in the dollar, and the surge in gold represent a rare alignment of market trends that may indicate some measure of capital flight from the US. This pattern of market moves suggests that global and even some domestic investors are trying to cut their exposure to US assets and the dollar. The likely culprit is the administration’s effort to rapidly and fundamentally change the US economic relationship with the rest of the world. As long as that endeavor continues, and investors are unsure of where the to-and-fro of policymaking will take them, these trends are likely to remain in place. Therefore, over the coming months and quarters, the most attractive assets may be much different than what we and other observers had expected at the start of the year. In particular, any continued US capital flight is likely to favor foreign equities, foreign currencies, and gold in the near term.