Asset Allocation Weekly (March 24, 2017)

by Asset Allocation Committee

In a recent Bloomberg Surveillance podcast,[1] Sebastian Mallaby made an interesting observation about the recent Fed tightening.  He noted how the asset markets mostly ignored or cheered the move.  Mallaby suggested that this isn’t necessarily a good outcome, meaning that central bank tightening should not be welcomed by the financial markets.  When it is, it can make the markets complacent; this is one of the main tenets of Hyman Minsky’s research.

This chart clearly shows how financial markets have changed.

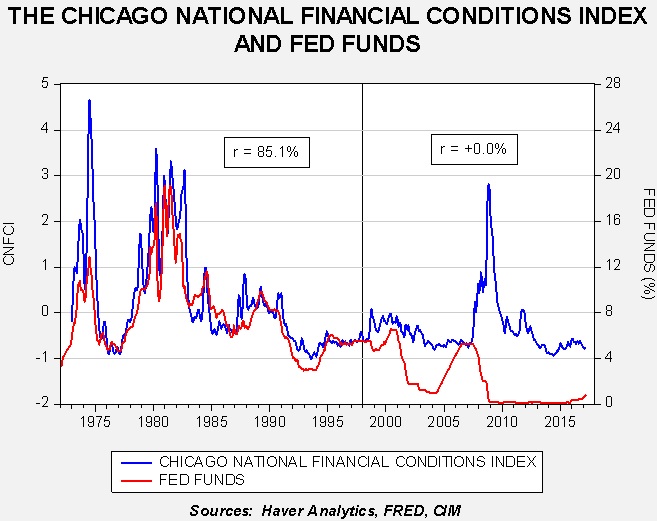
The blue line on the chart shows the Chicago FRB Financial Conditions Index.  It measures the level of stress in the financial system.  It is constructed of 105 variables, including the level of interest rates, credit spreads, equity and debt market volatility, delinquencies, borrower and lender surveys, debt and equity issuance, debt levels, equity levels and various commodity prices (including gold).  A rising line indicates increasing financial stress.  The red line is the effective fed funds rate.  Until 1998, the two series were positively and closely correlated.  When the Fed raised rates, financial stress rose; when the Fed lowered rates, stress declined.

We believe one factor that changed this relationship is policy transparency.  Starting in the late 1980s, the Fed became increasingly transparent.  Before 1988, for example, the FOMC would meet but issue no statement about what it had decided to do.  Investors and the financial system had to guess if policy had been changed.  Starting in 1988, the central bank began publishing its target rate.  In the 1990s, it began issuing a statement when rates changed; eventually, a statement followed all meetings.  As the FOMC has become more transparent, the correlation between stress and the level of fed funds has changed.  Essentially, the markets now know with a high degree of certainty when rate changes are likely.  This is especially true of tightening.  The FOMC appears to avoid making rate hikes that surprise the market.

Central bank policy goals are another factor that may have changed the stress/fed funds relationship.  Although Congress has specifically tasked the Fed with managing full employment and low inflation, all central banks exist to act as lenders of last resort.  Central banks provide liquidity during panics to prevent widespread financial firm failures during crises.  For most of the post-Depression period, the financial system was heavily regulated; investment banking and commercial banking were separated by Glass-Steagall, and the Bank Holding Company Act restrained bank operations across state lines.  This led to a high number of small commercial banks.

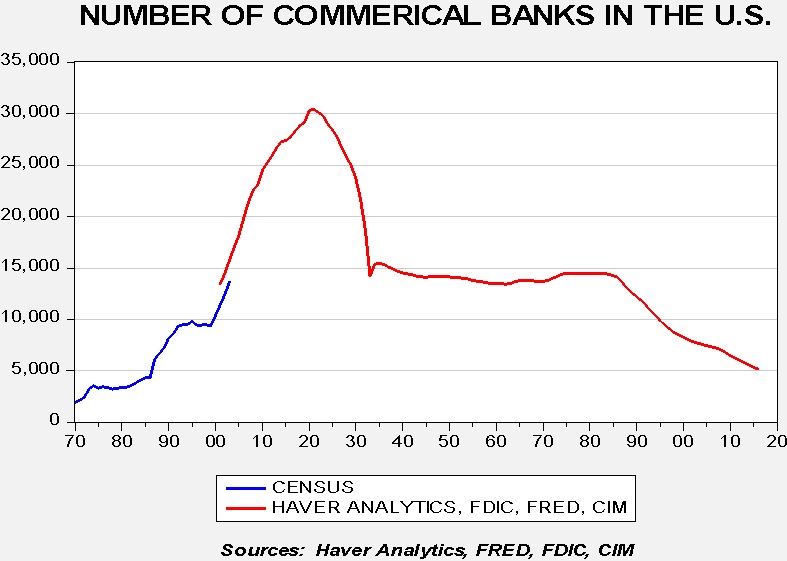
This chart shows the number of commercial banks in the U.S.  There is a break in the series around 1905; we have put together a time series from a variety of sources.  There was a sharp consolidation of banks during the 1920s into the early years of the Depression.  Banking regulation kept the number mostly stable.  Financial institution failures show how the financial system stabilized from the mid-1930s into the early 1980s.

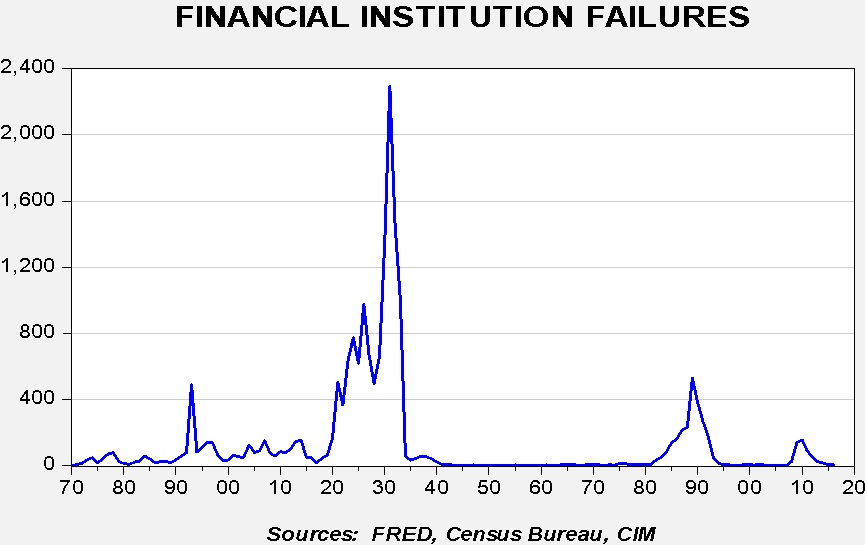
Financial firm failures began to rise during WWI and spiked during the Great Depression.  The regulatory environment focused on stability until the 1980s, when deregulation began.  The goal of deregulation was to improve the efficiency of the banking system.  Although it did improve efficiency, it also made it more fragile.  The rise in failures in the 1980s was due to the S&L Crisis, while the recent rise was due to the Great Financial Crisis.

From the mid-1930s into the early 1980s, the Federal Reserve did not have to concern itself with financial stability.  In a world of widely distributed, heavily regulated commercial and investment banks, the odds of failure were low and the impact from any particular failure was insignificant.  Thus, monetary policy could be conducted simply to manage the goals of controlled inflation and full employment.  However, in the current deregulated environment, the Fed now has to be concerned with financial system stability.  This is why we believe the central bank has opted to become more transparent.  The problem is, that by adopting this policy, the central bank has lost control over financial stress.  The data indicates that when the FOMC raises rates, financial stress tends to remain stable…until some sort of crisis occurs.  And, perversely, easing policy seems to have little effect on reducing stress.

Instead, what seems to happen is that monetary policy, by being transparent and designed not to increase financial stress, leads to overconfident investors who tend to build asset prices to unsustainable levels.  This leads to eventual asset price corrections and easier monetary policy.  Following Hyman Minsky’s theory, low financial stress becomes the catalyst for rising asset prices that eventually become problematic; unfortunately, the usual response of easing monetary policy does little to reduce financial stress.

What does this mean for investors?  Sadly, it means that monetary policy seems designed to maintain low levels of financial stress and tends to lift asset prices to the point of unsustainability, which then leads to painful corrections.  This isn’t the only factor involved; this same monetary policy tends to foster long economic expansions which also support asset prices.  Although each investor’s goals and risk tolerance is different, this analysis suggests that risks are higher than they first appear and balanced portfolios are one of the better longer term responses to this condition.

View the PDF

________________________________

[1] https://www.bloomberg.com/news/audio/2017-03-16/trump-s-budget-is-borderline-incompetent-furman-says

Weekly Geopolitical Report – The Rise of AMLO: Part II (March 20, 2017)

by Thomas Wash

In their next general election, Mexicans will cast their vote for the 64th president of the country’s history. The two frontrunners are Margarita Zavala from the National Action Party and Andres Manuel Lopez Obrador (AMLO) from the National Regeneration Movement (MORENA). Although the election won’t be held until July 2018, current polls suggest that AMLO would win by a small margin if the election were held today. His recent surge can be partially attributed to growing nationalism in Mexico due to Donald Trump’s election as president of the United States.

AMLO’s core supporters can be broken into two groups, those who are against neo-liberal economic reforms and those who want more social benefits. He derives most of his support from the southern region of Mexico, primarily in the states of Tabasco and Chiapas, where there is a significant indigenous population. To get an idea of how his supporters view him, imagine a politician with Bernie Sanders’s righteousness and Donald Trump’s brashness. AMLO is known for participating in protests, and was once left bloody from an altercation with police. He also hurls insults at his political rivals in the PRI and PAN parties, labelling them as the “mafia elite.” Recently, he held a pep rally in California to criticize Donald Trump’s immigration policies and vowed to take his complaints to the United Nations. If AMLO wins the presidency, it could adversely affect the already tense relationship between the U.S. and Mexico.

This week’s report will be divided into three sections. First, we will offer a brief biography on AMLO. Next, we will analyze his possible policy agendas and discuss the likelihood that he wins the presidency, followed by possible market ramifications.

View the full report

Asset Allocation Weekly (March 17, 2017)

by Asset Allocation Committee

The FOMC has moved on rates; as expected, the Fed lifted its target fed funds rate to a range between 75 bps and 100 bps.  The projections are for a 1.50% rate by the end of 2017 and a 2.25% rate by the end of 2018.

In this week’s report, we want to examine the current neutral policy rates that are generated by our variations of the Mankiw Rule.  The Mankiw Rule attempts to determine the neutral rate for fed funds, which is a rate that is neither accommodative nor stimulative.  The Mankiw Rule is a variation of the Taylor Rule.  The latter measures the neutral rate using core CPI and the difference between GDP and potential GDP, which is an estimate of slack in the economy.  Potential GDP cannot be directly observed, only estimated.  To overcome this problem with potential GDP, Mankiw used the unemployment rate as a proxy for economic slack.  We have created four versions of the rule, one that follows the original construction by using the unemployment rate as a measure of slack, a second that uses the employment/population ratio, a third using involuntary part-time workers as a percentage of the total labor force and a fourth using yearly wage growth for non-supervisory workers.

When we create each model, a deviation from the neutral rate is generated and this deviation is compared to the distribution of deviations.  In general, one standard error should capture 66% of the deviation from forecast, assuming normally distributed deviations.  When the deviation is inside of one standard error, it is generally within the acceptable range.

The charts above show our four variations of the Mankiw Rule.  We have published the neutral rates for each model on each chart.  Two of the variations, using the unemployment rate and involuntary part-time employment, are well outside the lower standard error line, suggesting easy policy.  However, the variations using the employment/population ratio and wage growth for non-supervisory workers is at or within one standard error, which indicates that policy is closer to neutral.

So, what does the FOMC think is the appropriate variation?  Given their forecast of a 1.50% rate by year’s end, we would argue that they are probably leaning toward the most dovish variation, the one using the employment/population ratio.  As we argued earlier,[1] the employment/population ratio has been a better guide to wage growth than the unemployment rate.  If this is correct, the longer term expectation for a policy rate of 2.25% is based on expectations that core CPI will rise or there will be continued improvement in the employment/population ratio.  If neither occur, we could be at the terminal rate by year’s end.

Overall, this means the FOMC, while raising rates, still has a mostly dovish bent.  By choosing the most dovish variation of the Mankiw Rule, we are likely closer to the end of this rate cycle, assuming that core CPI remains mostly steady and the employment/population ratio doesn’t unexpectedly rise.  Such a stance is bullish for equities; however, it may be bearish for the dollar which may bring some adjustments to our current asset allocation mix.

View the PDF

____________________________

[1] See Asset Allocation Weekly, 2/10/2017.

Weekly Geopolitical Report – The Rise of AMLO: Part I (March 13, 2017)

by Thomas Wash

Although many populist movements today, especially in the West, are viewed as a recent phenomenon, it is worth noting that Latin America has had a long history with populism. Populists in South American history include Hugo Chavez in Venezuela, Juan and Eva Perón, along with Nestor and Cristina Kirchner, in Argentina, Juan Evo Morales in Bolivia, and Alan Garcia in Peru, just to name a few. It should then come as no surprise that the leading presidential candidate in Mexico is also a populist.

Andres Manuel Lopez Obrador, who goes by AMLO, is no stranger to the presidential election process. He has run for the Mexican presidency twice, in 2006 and 2012, losing both highly contested elections by a margin of 0.59% and 6.62%, respectively. Prior to running for Mexico’s highest office, he was the mayor of Mexico City, where he left office with an 84% approval rating. His supporters, especially those located in the southern region of Mexico, view him as their champion.

In Part I of this report, we will examine the history of Mexico to understand AMLO’s appeal and relevance in Mexico today. The report will be divided into four sections: 1) Mexican Revolution; 2) Nationalization of PEMEX; 3) Post-Cardenas Period and the Mexican Miracle; and 4) The Lost Decade. This historical background will help readers understand the rise of AMLO, which will be discussed in Part II next week.

View the full report

Asset Allocation Weekly (March 10, 2017)

by Asset Allocation Committee

As the FOMC prepares to raise interest rates, it’s a good time to update our views on long-term interest rates.  The chart below shows our current estimate of fair value for the 10-year Treasury.

The model uses fed funds, the 15-year moving average of CPI (an inflation expectations proxy), the yen/dollar exchange rate, oil prices and German bond yields.  The current yield is about 42 bps above fair value; we move above one standard error of fair value at a 10-year yield of 2.70%.  Assuming the other variables remain steady, the current yield on the 10-year T-note has discounted fed funds of 1.80%, suggesting that a series of rate hikes is already in the market.

The factor that could lead to a bigger bear market in long-duration fixed income would be a change in inflation expectations.  Our inflation proxy estimates inflation expectations of 2.1%, which is roughly in line with the implied 10-year inflation rate from the TIPS spread.  Our worry about inflation expectations is that older investors could ratchet higher if the new administration’s policies raise inflation concerns.

This chart shows the average adult (ages 16 to 60) experience of inflation for 60-year-olds.  It’s currently 4.2%.  It should be noted that younger Americans have, on average, experienced lower levels of inflation; the inflation experience of the current 50-year-old cohort is only 2.8%.  We expect older investors to favor fixed income to preserve capital and replace wages in retirement.  We also assume that fixed income investors are sensitive to inflation and base their inflation expectations on long-run inflation experiences.  Thus, if new government policies on trade and infrastructure spending raise fears of inflation, older Americans may be more prone to “inflation panic” and demand higher rates.  Over the next 18 months, that is probably the greatest risk to long-duration fixed income.

For now, we remain cautious on long rates and have tended to favor credit risk over duration risk in fixed income.  However, if inflation expectations remain anchored (and tighter monetary policy should assist in this effort), then long-duration fixed income assets could become more attractive as the Fed’s tightening cycle continues.

View the PDF

Weekly Geopolitical Report – The Assassination of Kim Jong Nam (March 6, 2017)

by Bill O’Grady

On February 13th, Kim Jong Nam, the older half-brother of Kim Jong Un, the leader of the Democratic People’s Republic of Korea (DPRK), was assassinated at an airport in Malaysia.  This event offers insights into the “Hermit Kingdom” and shows the audacious nature of the regime.

In this report, we begin with a biography of King Jong Nam.  Next, we will recap the assassination.  The following section will discuss the context of the murder, including China’s difficult relations with North Korea and potential rationale behind the assassination.  As always, we will conclude with potential market ramifications.

View the full report

Asset Allocation Weekly (March 3, 2017)

by Asset Allocation Committee

Since the election of President Trump, a number of sentiment indicators have risen strongly.  There is concern that the improving sentiment isn’t warranted.  In this week’s report, our research supports the conclusion that improving sentiment is better described as a reflection of the overall state of the economy.  In other words, our analysis suggests that the improvement in sentiment is actually more in line with the economy and the earlier pessimism was probably excessive.

The chart on the left shows the National Federation of Independent Business (NFIB) Optimism Index and the one on the right is the Philadelphia FRB Business Conditions Index (BCI).  Both have jumped since the November elections.  Consumer confidence has improved as well.

To compare how the business sentiment indicators have reacted to the actual data, we compared the aforementioned NFIB and BCI indices to the Chicago FRB’s National Activity Index (CFNAI).  The latter index is a broad-based measure of the economy that captures both business and household activity.  To reduce the volatility in all these measures, we have smoothed them with a six-month moving average.

Note that in both cases, the sentiment indicators and the CFNAI have tended to track each other.  Interestingly enough, post-2008, small business sentiment has dramatically lagged the overall performance of the economy.  It would appear that concerns about the Affordable Care Act and other regulations dampened small business sentiment.

These two charts show the results of regressions where the CFNAI is the dependent variable and either the NFIB or the BCI is the independent variable.  When the model suggests that sentiment is too pessimistic relative to the economy, the deviation line is above zero.  The recent jump in the NFIB (on a smoothed basis) suggests that small business sentiment is just now reflecting the overall economy.  That could mean that if sentiment remains elevated either the model will turn optimistic or, perhaps, the economy will improve.  The Philadelphia FRB BCI has just turned modestly optimistic but remains in the normal range of deviation values.  Thus, the improvement in sentiment is notable but appears to be more of a reversion to the actual performance of the economy.  Interestingly enough, both models indicate that the impact of sentiment on the economy is coincident, meaning sentiment doesn’t necessarily lead to better economic performance.  At the same time, the models also suggest that the improvement in sentiment doesn’t signal conditions of excessive optimism, either.  This means that the rise in sentiment isn’t necessarily creating conditions of disappointment which might adversely affect equity markets.

View the PDF

Weekly Geopolitical Report – Germany: The Reluctant Superpower (February 27, 2017)

by Bill O’Grady

Two recent articles caught our attention.  First, the New York Times discussed growing worries in Germany about a post-American Europe,[1] given the potential withdrawal of the U.S. from the superpower role.  Second, an op-ed in Der Spiegel went so far as to suggest that Germany should become the world leader of an anti-Trump coalition.[2]

These reports are indicative of the rapidly changing views on how the U.S. manages its superpower role.  The fact that Germans are considering their options in response to American foreign policy is a significant development.

In this report, we will start with the background of American foreign policy post-WWII to the present.  This will set the stage for why Germany feels compelled to adjust its foreign policy.  From there, we will reflect on how Europe and the rest of the world could react to a hegemonic Germany.  As always, we will conclude with potential market ramifications.

View the full report

________________________________

[1]https://www.nytimes.com/2017/02/06/world/europe/germany-prepares-for-turbulence-in-the-trump-era.html

[2] http://www.spiegel.de/international/world/a-1133177.html

Asset Allocation Weekly (February 24, 2017)

by Asset Allocation Committee

Emerging market equities have been the best performing asset class year to date among the 12 we use in our asset allocation program.  Given that we currently have no exposure to emerging markets, it makes sense to review this market stance.  The U.S. dollar is one of the key variables impacting the relative performance of emerging markets to the S&P 500.

The blue line on this chart looks at the relative performance of emerging markets to the S&P 500.  When the line is rising, the S&P is outperforming emerging markets.  The red line is the JPM real dollar index.  The two series are positively correlated at 81.1%, meaning that a stronger dollar tends to reflect the S&P 500 outperforming the emerging markets.

It is worth noting that for the past few months both the dollar and the emerging markets/S&P ratio have been mostly range-bound.  Only since the Trump victory has the dollar broken out to the upside.  The lack of performance from the U.S. market relative to emerging markets may be signaling that equity investors don’t believe the dollar’s strength will be maintained.  The breakout is based on two expectations.  First, the FOMC will tighten credit further.  Although we do expect this to occur, it is also well anticipated.  Second, the Trump administration has promised fiscal stimulus in the form of infrastructure and defense spending, coupled with tax cuts.  In the past, fiscal stimulus has led to tighter monetary policy which will likely boost the dollar.  In addition, if President Trump implements trade impediments, the dollar will likely strengthen as well.

It is possible that some degree of doubt has developed about the likelihood of fiscal stimulus.  It is rarely remembered that new presidents take some time to assemble a team and work with Congress on getting new laws passed.  As the above chart shows, the last dollar spike in 2000 didn’t lead to a new high in the equity ratio.  Perhaps equity investors concluded that the greenback was probably near the end of its bull run.

At the same time, dollar strength has been associated with emerging market crises.  The Latin American Debt Crisis in the 1980s and the Asian Economic Crisis of the late 1990s coincided with dollar strength.  In addition, U.S. trade barriers will disrupt the prevailing model of development for emerging market nations.  Thus, in the coming months, our asset allocation process will need to determine if the risk/reward calculus for emerging equities makes sense.  Ultimately, it is difficult to make a bullish case for emerging equities without dollar weakness.  The longer dollar strength continues, the greater the risk that recent gains in emerging equities will not be sustainable.

View the PDF