Asset Allocation Weekly (June 1, 2018)

by Asset Allocation Committee

Last week, we discussed secular cycles in the Treasury market.  This week we will discuss equities.  The rule for secular cycles in equities is rather simple: the price/earnings (P/E) is the critical factor.  In general, profits tend to rise over time.  Driving the secular trend in equity markets is what investors are willing to pay for those earnings.

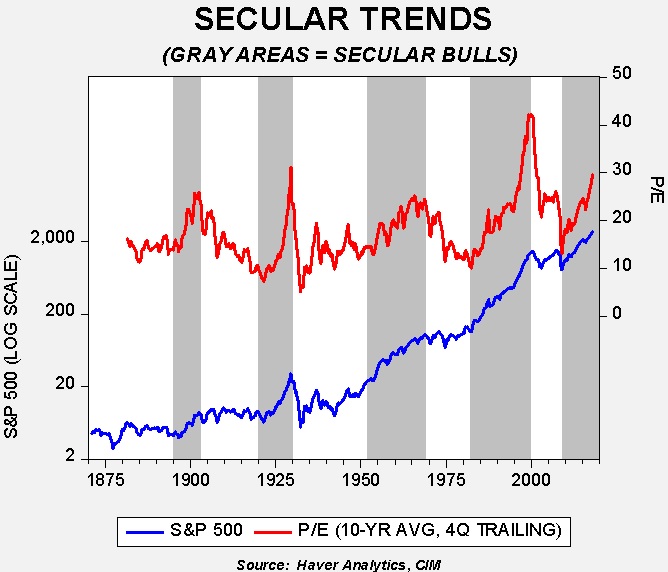
This chart shows the S&P 500 on the lower line (log-scaled) with the 10-year P/E on the upper line.[1]  Secular bull markets are shown in gray.  What generates the secular trend is the multiple.  When the P/E is rising (and the 10-year P/E generally shows the underlying trend in the multiple), equity values tend to rise as well.  Secular bear markets are characterized by flat to falling P/Es.

So, the key question is, “What drives the multiple?”  Most variables that are important are also complicated and the P/E is, too.  In general, the multiple is a sentiment indicator—it measures how optimistic equity investors are about future prospects.  Our analysis suggests that inflation plays a role as does general sentiment.

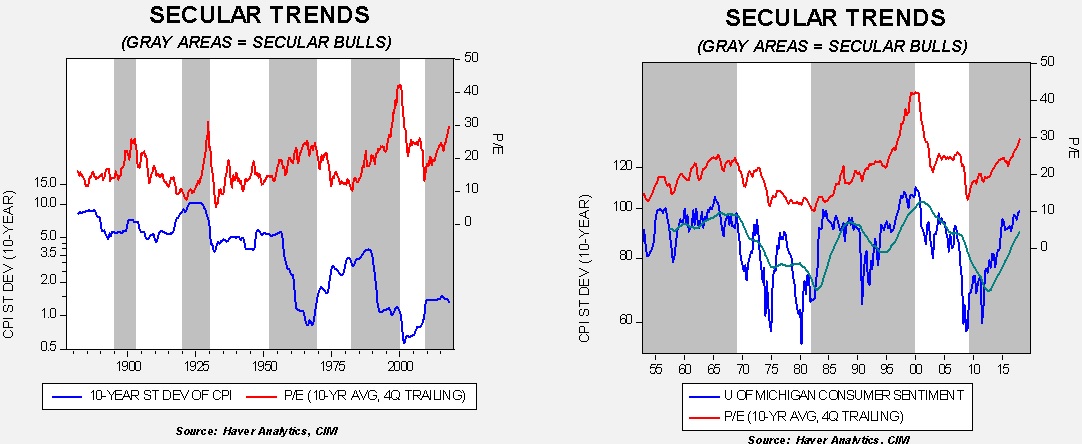
The chart on the left shows the aforementioned P/E with the 10-year rolling standard deviation of inflation.  Secular trends are shaded in gray.  Although not a perfect indicator, in general, rising inflation volatility tends to coincide with a lower P/E.  With all financial assets, inflation is an important variable.  Investors have balance sheets; in a way, inflation is the return on real assets so fears of rising inflation, expressed with rising volatility, should discourage investment in financial assets.  The chart on the right shows consumer sentiment.  Although the data is rather limited compared to inflation, it does show that periods of falling sentiment tend to coincide with P/E contraction.

There is an old saying that “bond investors don’t build hospital wings.”  In other words, equities are the best way to build wealth.  At the same time, investing in equities requires optimism about the future.  War, civil unrest, social disruption and geopolitical uncertainty should make citizens reluctant to invest.  For example, the end of the Cold War was likely a contributing factor to the steep rise in the P/E during 1995-2000.  Perhaps the relief that the Great Financial Crisis didn’t trigger another Great Depression boosted the P/E after 2008.

Our view on secular trends in equities is based on two factors—what is inflation doing and how do people feel?  Rising inflation and increasing volatility of price levels will tend to reduce investor optimism.  The perception of how society is doing will affect sentiment.  Inflation can be easily measured, while sentiment is more of an observational “call.”  At present, the secular bull market appears intact but under threat from two directions.  First, if populism gains traction then inflation will likely follow.  Second, the high level of political partisanship could eventually affect consumer sentiment.  If these trends gain strength, we may be entering into a new secular bear market in equities.  That would mean a period of steady to declining multiples.  Investors can still make positive gains in equities in such an environment, but passive investing tends to struggle during secular bear markets.

View the PDF


[1] The 10-year P/E is calculated by the 10-year average of nominal earnings divided by the current value of the S&P 500.  The multiple is similar to the Shiller P/E except that the latter deflates both by CPI.

Asset Allocation Weekly (May 25, 2018)

by Asset Allocation Committee

Last week we discussed the general idea of secular versus cyclical trends.  This week we will look at these concepts with regard to longer duration fixed income.

The goal of theory is always to simplify.  Theorizing is all about taking complex phenomena and reducing it to basic elements that can guide us in estimating the future.  However, as Albert Einstein noted, “Everything should be made as simple as possible, but not simpler.”  The yield on sovereign debt instruments should be a function of the policy rate and inflation expectations.  The longer the duration of the instrument, the more important inflation expectations are to the yield.  However, specific historical conditions do count.  For example, a nation’s credit risk can change over time; government borrowing behavior can play a role.  Even geopolitical risks can matter; Tsarist bonds traded at 95 rubles to par of 100 in late 1914, only to have the debt later repudiated by the Bolsheviks.[1]  Thus, secular trends can abruptly change if underlying conditions adjust significantly.

The above chart looks at inflation trends and the yield on 10-year T-notes.  For inflation, we use CPI from 1915 to the present; the data prior is the General Price Index.  Although not perfectly equivalent, the two indices do give general insight into inflation.  We have added a 10-year average of yields and a 15-year average of inflation to highlight the trends in the data.

Inflation behavior until the 1930s was rather erratic.  This was because the U.S. was on the gold standard and the money supply was partly driven by mining activity and partly driven by industrial activity.  In other words, deflation is highly likely if the money supply is fixed while output is rising rapidly (as was the case during the industrial revolution).

These charts show the behavior of our inflation series; the chart on the left shows the dispersion during the years 1810 until June 1933, when President Roosevelt ended the ability of citizens to hold gold.  The average inflation rate over this time frame was a mere 0.5%; however, range was wide.  Note that the highest rate recorded was 34.4% during the Civil War and the lowest was 16.2% during a downturn after there was a lull in public investment.  During this period, deflation occurred almost 53% of the time.  After June 1933, the average inflation rate rose to 3.6% but the range narrowed significantly, from 19.7% after WWII to a low of -4.1% during the 1936-37 recession.  Deflation only occurred 6.5% of the time after Roosevelt ended the gold standard.  Economists discovered that people have an asymmetric response to inflation and deflation—rising prices tend to spur buying which supports growth, while deflation can lead consumers to stop buying in anticipation of even lower future prices.

It would be reasonable to assume that longer duration yields would be rather low during the period when deflation was common.  In fact, they averaged 4.6% in the years from 1810 to 1933.  Yields remained low during the Great Depression, and, during WWII, the Treasury forced the Federal Reserve to keep rates low to reduce borrowing costs.  Thus, the “modern era” really begins in March 1951 with the Federal Reserve-Treasury accord.  That pact allowed the Federal Reserve to set interest rates based on economic conditions.  In theory, central bank independence is generally thought to lead to better inflation control.  In the absence of an external restraint on money creation, i.e., gold, central bank independence should create conditions of better inflation control.  However, from the 1950s into the early 1980s, the Federal Reserve raised short term interest rates to try to quell steadily rising inflation.  Since the policy rate acts as an anchor for longer duration instruments, T-note yields rose during this period.  The average yield on T-notes from March 1951 to the present is 5.1%.  However, as the above charts show, long-duration rates steadily rose until the early 1970s and then rose rapidly with each business cycle until peaking in late 1981.  By the late 1970s, policymakers were moving aggressively to contain inflation through strict monetary policy, deregulation and globalization.  Those policies triggered a secular bull market in bonds that continues to this day.

We believe this bull market in bonds is likely nearing an end.  Populism is becoming an increasingly potent force throughout the West.  In general, populism usually leads to re-regulation and deglobalization.  These factors should, over time, lead to steadily rising inflation and bond yields.

Our base case is that we will likely see a gradual increase in yields over the next 10 to 20 years.  We do not expect that increase to be sudden, but do look for higher high yield and higher low yield in each business cycle.  The asset allocation committee believes this situation can be managed with a modest shortening of duration and the use of “ladders” using target-date exchange-traded products.

However, as part of our scenario planning, there is the possibility that we may see discrete jumps instead of a gradual increase in interest rates.  This is due to the generational experience of inflation.

This chart shows the adult experience of inflation, starting with age 16.  The current 64-year-olds have experienced the highest average adult inflation, at 4.1%.  Note that the experience of inflation declines rapidly for the current age cohort in their 50s.  Over time, the area of the graph will shift to the right, meaning that society’s memory of the high inflation years will gradually diminish.  However, that isn’t the case now; a significant cohort remembers inflation and, if populist policies expand quicker than we expect, the baby boom generation could react strongly and trigger inflation fears.

If inflation fears are triggered, we could see a bear market in bonds develop characterized by rapid spikes in long-term interest rates that choke off growth and lead to less stable financial markets and shorter business cycles.  This is not our base case.  However, the particular demographic pattern could lead to this outcome, which we will monitor closely.

View the PDF


[1] http://www.helsinki.fi/iehc2006/papers1/Oosterli.pdf, page 34.

Weekly Geopolitical Report – Reflections on Cyberwar (May 21, 2018)

by Bill O’Grady

(Due to the Memorial Day holiday, our next report will be published on June 4.)

On Saturday, May 11, the New York Times ran an article on the threat of Iranian cyberattacks.[1]  Although the report didn’t necessarily break any new ground, cyberwar does pose some interesting issues for American hegemony.  In this report, we will begin with American military superiority and the increase in unconventional threats.  From there, we will discuss the impact of near abroad risks on hegemony.  The problem of security and efficiency will be addressed and, as always, we will conclude with market ramifications.

The American Military
On January 16, 1991, the air campaign of the Gulf War began.  By February 28, 1991, the conflict was over.  Going into the war, there was concern about the American military’s ability to successfully fight a war half a world away against a hardened Iraqi army, given that the U.S. hadn’t conducted a major military operation since Vietnam.

Although it would be unfair to discount the contributions from the allies in the conflict, the reality was that the Gulf War was an American-conducted event.  Of the 750k soldiers who participated in the ground campaign, over 70% were American.

The results, at least for the allied side, were phenomenal.  The air campaign lasted 42 days, with the allies conducting over 100k sorties.  The ground phase of the war officially began on February 24, 1991, and was halted three days later, with a ceasefire called on February 28, 1991.  In the conflict, 150 American soldiers lost their lives.

It was clear the American military had improved since Vietnam.  The air campaign undermined Iraqi command and control, isolating Iraqi troops in the field.  Once the combined air forces achieved air supremacy, Iraqi troops were in a precarious position.  By the time allied ground forces entered the field, Iraqi troops were poised to be routed.  The American way of war, which combined multiple aircraft platforms, signals intelligence, rapid armored movement and highly trained troops, was a form of “shock and awe.”

The U.S. military showed the world that entering into a conventional conflict with the U.S. was probably foolhardy.  Although the flat desert terrain was almost ideal for U.S. war planners, the fact remained that the military had learned to fully integrate the armed services into a single functional unit that could deliver precise, overwhelming firepower.

So, how does a nation deal with the U.S. military?  Numerous trends have developed.

View the full report


[1] https://www.nytimes.com/2018/05/11/technology/iranian-hackers-united-states.html

Asset Allocation Weekly (May 18, 2018)

by Asset Allocation Committee

In our asset allocation process, we focus on cyclical trends; that doesn’t mean we pay no attention to secular trends but it isn’t our primary emphasis.  The lack of clarity around what these terms mean can lead to confusion.  And so, over the next few weeks, we will examine the difference between the two trends and how we address them in our asset allocation process.


This chart shows a stylized example of cyclical and secular cycles.  It’s simply for illustration purposes, but it does express the general view of how we view markets.  In reality, cyclical trends are not this smooth or regular, but rather often exhibit varying length and amplitude.  Secular trends are not necessarily constant either.  But, in general, as we will look at in the coming weeks, financial and commodity markets exhibit both trends.

Depending on the market, cyclical trends tend to run three to 10 years.  It is the most important trend in our asset allocation process.  The business cycle is the primary factor in our analysis.  The business cycle is the normal tendency for the economy to move from expansion to decline, recession, recovery and back to expansion.  This cycle clearly affects financial and commodity markets.  Financial market conditions, monetary and fiscal policy and geopolitical events are all important contributors to cyclical trends as well.

On the other hand, secular trends can last generations.  These trends tend to be driven by societal factors.  For example, public attitudes toward the balance between efficiency and equality are critical as these are affected by regulatory and tax policy.  Long-term geopolitical stability is mostly a factor of hegemony; if a superpower vacuum is developing or a new hegemon is emerging, secular trends can adjust.  What makes secular trends important is that because they last a long time, they become part of the background, leading investors to assume that these trends never change.  And so, in the early part of a reversal in secular trends, actual market performance can vary widely from what is expected.  The other factor that matters in secular trends is that, unlike our stylized model, they don’t always clearly shift, causing a degree of uncertainty as to whether the change actually occurred.  Only with the hindsight of history can we definitively know when and if the secular change happened.  Still, we pay attention to secular trends because, at inflection points, the impact on financial and commodity markets can be significant.

Therefore, over the next few weeks, we will examine the cyclical and secular trends in commodity, equity and debt markets.  In general, this analysis will offer insights into our allocation process, discussing the important cyclical elements of each asset class along with the potential impact of a change in secular trends.

View the PDF

Weekly Geopolitical Report – The Marshall Plan: A Review (May 14, 2018)

by Bill O’Grady

We occasionally run across a book that we deem important enough in the arena of geopolitics to warrant a full report dedicated to its review.  Recently, we happened upon a book that fits this requirement, The Marshall Plan: Dawn of the Cold War by Benn Steil.[1]  This book details the history of the Marshall Plan, discusses how the plan developed and identifies the major historical figures who created the strategy.  Furthermore, more importantly for the present, it shows how this generation of policymakers addressed the geopolitical problems of Europe, issues that have resurfaced since the Cold War ended in 1991.

In this report, we will review the state of Europe after the war, focusing on U.S. and Soviet goals for the postwar era, and discuss the important figures of the era and the legacy they left behind.

Postwar Europe
Prior to the official end of WWII, Joseph Stalin, Franklin Roosevelt and Winston Churchill had begun negotiating how the postwar world would be managed.  Roosevelt believed voters would not accept a permanent American military presence in Europe and thus intimated to Stalin that the U.S. would exit two years after the German surrender.  Churchill was mostly focused on maintaining the British Empire, a position Roosevelt seemed determined to undermine.  As the three drew up plans, Stalin sought to create a security buffer as far into Western Europe as he could press it.

View the full report


[1] Steil, B. (2018). The Marshall Plan: Dawn of the Cold War. New York, NY: Simon & Schuster.

Asset Allocation Weekly (May 11, 2018)

by Asset Allocation Committee

Recently, U.S. equities have outperformed emerging market equities.

The chart above shows the relative performance of emerging market equities against U.S. equities.  A rising line indicates that foreign equities are outperforming.  Questions are being raised as to whether this recent decline is the end of what has been a strong relative uptrend in emerging equities that began near the end of 2016.

The above chart shows the same relative performance ratio along with the JPM dollar index.  In general, emerging equities tend to trade opposite the dollar.  In the past few weeks, the dollar has rallied after peaking in early 2017.  We suspect this has mostly been a short-covering rally (surveys suggest market participants have been leaning heavily against the greenback), although there has been concern that interest rate differentials may be supporting the dollar as well.

Our basic valuation model for exchange rates is purchasing power parity, which assumes that exchange rates offset price differences between countries.  In general, nations with higher inflation tend to have weaker exchange rates to equalize prices.  The model is not perfect; not all goods are tradeable and trade regulations can interfere with the ability of floating exchange rates to generate “the law of one price.”  However, the historical record does suggest that when exchange rates deviate significantly from the fair value generated by the parity calculation, it is more probable that the trend will reverse over time.  Currently the major exchange rates are running below parity.

These four charts show the parity models for the D-mark (a proxy for the euro), the British pound, Japanese yen and Canadian dollar.  All are, or have recently, been a standard error or more from fair value.  This would suggest the dollar has more room to decline.

What about the widening interest rate differential?  After all, the FOMC is tightening policy faster than the rest of the world.  Although interest rate differentials affecting exchange rates makes intuitive sense, the small gains one can make from the differences in interest rates can be easily swamped by exchange rate moves.  And, high interest rates alone are not necessarily signals of strength; recently, Argentina raised overnight rates to 40% to support the peso.[1]  Such policy actions belie the notion that high interest rates automatically make a currency attractive.  Still, between nations of similar credit characteristics, all else held equal, the nation with the higher interest rates would likely see a higher exchange rate.

Adding the interest rate differential with a 30-month lag suggests the impact of interest rates isn’t all that significant.  Due to the lag, the differences in interest rates will tend to offer support to the dollar but, by far, the impact of relative inflation is more robust.  Thus, if inflation in the U.S. does rise relative to German inflation, the impact of higher rates will be lessened.

In conclusion, the recent rally in the dollar and pullback in emerging markets does bear watching, but the underlying fundamentals still support the emerging market allocation.  Thus, without ample evidence to suggest otherwise, we expect emerging market equities to recover from recent weakness.

View the PDF


[1] http://www.bbc.com/news/business-44001450

Asset Allocation Weekly (May 4, 2018)

by Asset Allocation Committee

The continued rise in long-term interest rates, with the 10-year T-note breaking above a 3.00% yield, is becoming the focus of financial markets.

Here is our updated 10-year T-note model.

The model’s core variables are fed funds and the 15-year moving average of inflation, which we use as a proxy for inflation expectations.  The other four variables are the yen, oil prices, German long-duration sovereign yields and the U.S. fiscal deficit as a percentage of GDP.  The current yield on the 10-year T-note, which has recently moved above 3.00%, is running above fair value.  The standard error for this model, shown on the lower part of the graph as the lines running parallel to the midpoint, is ±70 bps.  Thus, a level that would signal excessively high yields is 3.35%.

Looking at the components of the model, fed funds are usually responsible for cyclical shifts in long-duration assets while changes in inflation expectations drive secular trends.  The lift in yields would be significant if we were seeing a sustained rise in inflation.  For example, assuming no change in any of the current variables, moving up inflation expectations by 100 bps would raise the fair value to 3.3%.  Assuming fed funds at 3.00% with this level of inflation expectations would generate a fair value yield of 3.81%.

Instead, it appears that expectations of tighter monetary policy are the key factor in lifting 10-year Treasury yields.  We estimate the terminal policy rate from the Eurodollar futures market, using the implied yield from the two-year deferred contract.  Based off that measure, the FOMC will raise rates to around 3.00%.

Assuming 3.00% fed funds over the next two years, our T-note model yields a fair value of 3.17%.  Essentially, it appears the Treasury market has discounted a terminal fed funds rate of 2.75%; as the above chart shows, the FOMC tends to lift the fed funds rate until the implied Eurodollar rate falls below the current fed funds rate.  The bottom line is that there is a high probability of increased long-duration rates but we are rapidly approaching a level that should discount policy tightening.  If inflation expectations become unanchored, even higher rates are possible but we don’t think this scenario is likely.

As the first chart shows, it isn’t uncommon for the 10-year yield to overshoot fair value to reach one-standard error above the forecast; that would imply a 3.87% peak.  Any yield around that level would lead us to become aggressively bullish on long-duration assets.  We don’t expect that development to occur; it has been nearly 13 years since the T-note model signaled that degree of undervaluation.  Assuming economic growth remains relatively modest and inflation mostly steady, the current level of undervaluation probably signals a period of consolidation.

View the PDF

Weekly Geopolitical Report – Generational Change in Cuba? (April 30, 2018)

by Bill O’Grady

On April 18, the Cuban National Assembly elected Miguel Diáz-Canel as the new president of Cuba.  On the following day, he was sworn into office.  There has been much media conversation about a generational shift in Cuba.  In this report, we will discuss the potential for change on the island nation, which has been communist since the 1959 Cuban Revolution.

We will begin this analysis with a refresher on communist government structure.  A short biographical sketch of the new president will follow, which will include a list of previous heir apparents who were, for various reasons, deemed unworthy.  Next, we will examine why Miguel Diáz-Canel emerged as the winner and what it portends for Cuban foreign and economic policy.  Finally, we will conclude with potential market ramifications.

Typical Communist Government Structure
Marx envisioned that communism would lead to a “withering away” of the state as the proletariat would take control of the means of production across the world and thus the need for government would cease.  However, Marx never detailed how this process would actually occur.  Because this endpoint was undefined, as communist nations emerged, the revolutionaries who overthrew existing governments were forced to form replacement administrations.  They generally settled on a parallel structure of government and party.  Communist states usually only have one accepted party so the separation of party and state was mostly fiction.  However, it was common to see the head of the government usually called the premier (as in the Soviet Union) or president (as in Cuba and China).  In China, for example, the general secretary of the Communist Party of China and the office of the president are held by the same person.  Recently, Chairman Xi was able to end term limits on the office of the president, allowing him to maintain that position past 2023.[1]  Although the office of president in a communist state is generally ceremonial, in China, it was important enough for Chairman Xi to insist on keeping the position past two terms.

The elevation of Miguel Diáz-Canel to president isn’t significant in terms of Cuba’s power structure.  Raúl Castro remains head of the Communist Party of Cuba and therefore holds the reins of power.[2]  However, it is possible that the new president could become the leader of Cuba’s communist party when Castro, who is 86 years old, steps down.  Then again, there is no guarantee this will occur.  Osvaldo Dorticós Torrado was president of Cuba from 1959 to 1976 when he was replaced by Fidel Castro, who unified the government and the party under himself.  As Fidel’s health deteriorated, he was succeeded in 2008 by his brother, Raúl, who held three positions of power—the presidency, leader of the Communist Party of Cuba and commander in chief of the military, the latter being a role he assumed after the revolution.  As this history shows, the return to separating the presidency from the leadership of the communist party would not be unprecedented.

View the full report


[1] See WGRs, Emperor Xi: Part I (3/5/2018) and Part II (3/12/2018).

[2] It should be noted that Castro will continue to be head of the armed forces as well, a position he has held since the 1959 revolution.

Asset Allocation Weekly (April 27, 2018)

by Asset Allocation Committee

In our recent rebalance, the Asset Allocation Committee added a position in gold.  There were two reasons behind the decision.  First, we estimate that gold prices are undervalued compared to relevant fundamental factors.

The chart on the left is our gold valuation model.  It uses the balance sheets of the Federal Reserve and the European Central Bank, the EUR/USD exchange rate and inflation-adjusted two-year Treasury yields.  The model currently indicates gold prices are deeply undervalued.  Much of this undervaluation is probably due to expectations of balance sheet contraction and higher real yields.[1]  For example, if the Fed’s balance sheet was cut to $3.0 trillion from the current $4.4 trillion, the fair value would drop to 1585.73 (assuming the other variables remain unchanged).  In other words, it appears the financial markets are discounting a more bearish turn in fundamentals than is probably likely.

The chart on the right shows the price of gold relative to the holdings of gold by exchange-traded products (ETPs).  The price of gold tends to track the holdings of ETPs with two periods of divergence.  Gold prices tended to track higher in both periods.

Second, gold is a flight-to-safety asset.  During periods of turmoil, investors will often shift to safety assets.  With the potential for a geopolitical event rising in the coming months, the committee has concluded that allocating some of the portfolio to gold is prudent.   Here are some of the potential events:

  1. North Korea: If talks between Kim Jong-un and President Trump go awry, the chances for war in the Far East rise significantly. We view these talks as “make or break”; if they fail, it is hard to see a path forward that doesn’t result in conflict.
  2. Iran: The Trump administration’s policies toward Iran are hardening. If the Obama-era nuclear deal is scotched and new sanctions are imposed, we expect Iran to move toward a nuclear weapon which increases the odds of a conflict.
  3. China: Trade tensions with China are rising. A full blown trade war will tend to boost inflation and if the Federal Reserve is constrained in responding due to political pressure then gold will be an attractive response.

For these reasons, we have added gold to the portfolio.  We will continue to monitor market conditions to address future risks.

View the PDF


[1] Note that from 2010 into 2012, the model indicated that gold was overvalued.  This was likely due to the market overestimating the degree of balance sheet expansion.